Sea ice charts of the Arctic and Antarctic Research Institute (AARI) are widely used nowadays for a variety of scientific and practical tasks. However, detailed description of ice charts composition still has not been published. In this paper, staff members of the Russian Ice Service (Center “Sever”, AARI), directly involved in ice charts composition, give information about sea ice analysis methodology and the data they use. Information presented is necessary for a correct ice charts use for different needs.
Key words: Arctic, sea ice analysis, sea ice concentration, sea ice age, sea ice chart, AARI, sea iceexpert, ice service
Today, five northern countries provide operational monitoring of sea ice in the Arctic. These are: Russia, Canada, the USA, Denmark, and Norway [1]. Sea ice observations are conducted all year round and serve as a basis for generating of ice products such as ice charts and ice forecasts. Ice products provided by different ice services vary in content and geographical region. So, Danish Meteorological Institute (DMI) focuses on waters around Greenland. The charts show areas of homogeneous sea ice conditions described by two ice parameters – sea ice concentration and stage of development (ice thickness). Besides, the ice charts show extent of land-fast ice and presence of icebergs. Norwegian Meteorological Institute (MET.NO) produces ice charts for European Arctic seas, and the charts contain information only on sea ice concentration and land-fast ice extent. Canadian Ice Service (CIS) monitors sea ice conditions within Canadian territorial waters located along the northern and northeastern coasts of the North America and in straits of the Canadian Arctic Archipelago. The charts show sea ice concentration, stage of sea ice development, and land-fast ice boundaries. The U.S. National Ice Center (NIC) ice charts cover the entire Arctic Ocean along with adjacent freezing waters of the North Pacific and North Atlantic. Regional ice charts of waters around Alaska are generated by the Alaska Sea Ice Program (ASIP) of the National Weather Service (NWS). The NIC and ASIP charts contain information on ice concentration, stages of development of ice, and land-fast ice boundaries. The Center “Sever” of Arctic and Antarctic Research Institute (AARI) in Russia produces ice charts for the European and Amerasian parts of the Arctic. In summer period (June to September), AARI ice charts contain information only on sea ice concentration and land-fast ice extent, while in winter (October to May) the data on stages of sea ice development is presented additionally. Besides polar seas, AARI also monitors freezing waters of the North Pacific as well as all inland seas sharing the borders with Russia. Melt season in these areas begins earlier than in the polar seas, so mapping of sea ice development stages finishes in April, before new ice formation. Besides above mentioned parameters, AARI charts depict such hazardous objects as grounded hummocks (stamukhas) and areas of iceberg risk. It should be noted that Canadian, American and Danish ice services generate routinely special charts of iceberg conditions around Greenland and in the North Atlantic. Russian, American, and Norwegian ice services cooperate in Antarctic sea ice monitoring. Examples of charts provided by foreign ice services are given in Figure 1. AARI ice charts are presented in sections below.
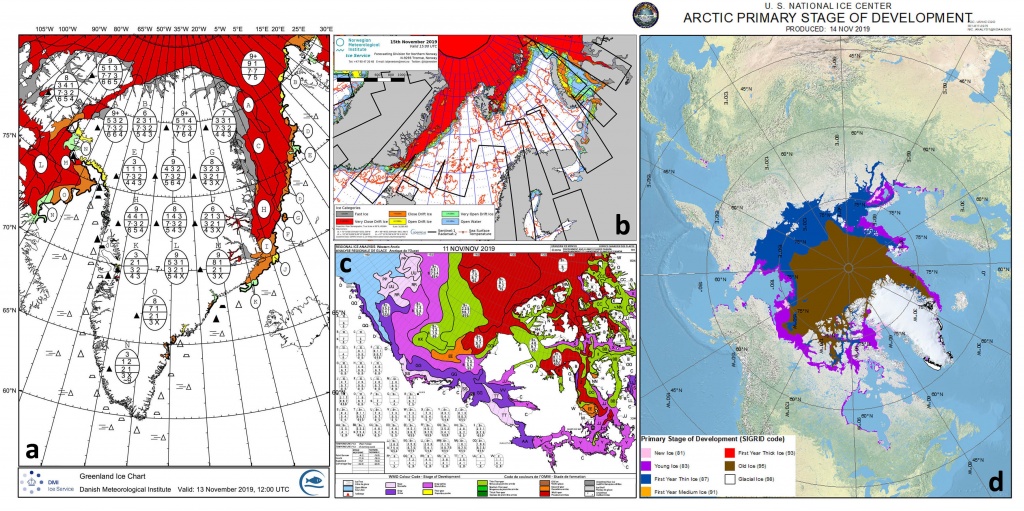
Fig.1.Ice charts produced by DMI (а) [2], MET.NO (b) [3], CIS (c) [4] and NIC (d) [5].
History of ice charting in AARI.
History of sea ice charting in AARI goes back to mid-1920s when occasional reconnaissance flights began in the Arctic aiming to gather information about sea ice conditions on the Northern Sea Route (NSR). In 1929, regular ice reconnaissance flights began over the Kara Sea, and in 1935 – over the Laptev Sea. Pioneering period of sea ice reconnaissance finished in1938, and since that time aerial observations had become regularly sheduled over the entire NSR area [6, 7]. In that early period, all sea ice features observed during the flight were immediately depicted on a paper blank directly onboard the aircraft. Ice observers recorded only the most general features, such as location of sea ice edge, land-fast ice boundaries, presence of vast ice floes, etc. Figure 2 represents the reconnaissance chart of waters near the Taymyr Peninsula (Kara Sea). The observer had noted land-fast ice in Nordenskjold archipelago, a polynya along the Taymyr coast, and zones of open ice and close ice pack seaward of the polynya. It should be mentioned, that there was no officially accepted sea ice symbology at that time. Nevertheless, symbols used in early ice charts are easy to understand.
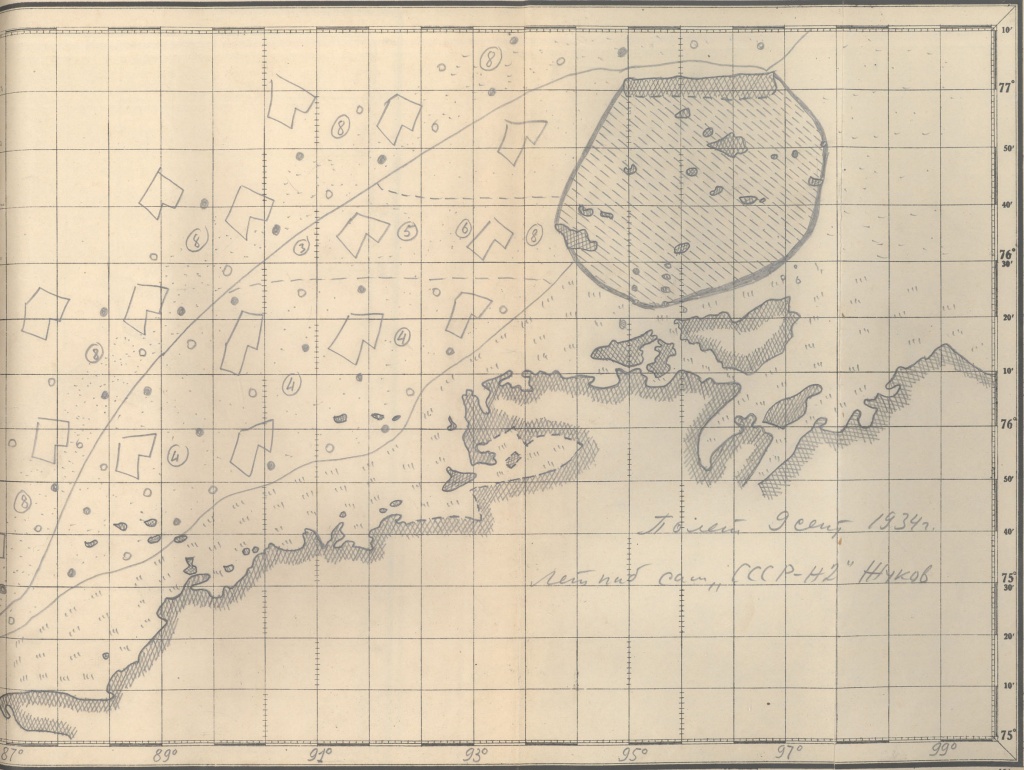
Fig. 2. Sea ice reconnaissance chart of waters adjacent to Taymyr Peninsula, Kara Sea. The chart was created during reconnaissance flight on September 9, 1934. (Source: the AARI archives).
Visual airborne observations were subsequently supplemented by a variety of instrumental methods enabled to collect information on sea ice conditions. Up to 1950s, aerial photography was the only source of data, but since early 1950s till 1980s, a variety of new techniques were implemented into sea ice monitoring, such as airborne panoramic and side-looking radars, infrared (IR) and microwave radiometers, remote radar systems for ice thickness measurements and laser profilometers [8, 9]. Data collected by these techniques was analysed by ice experts in order to produce ice charts. Invention of new tools allowed experts to obtain more characteristics of sea ice for detailed ice conditions. This progress required an improvement of sea ice classification accepted by the USSR in 1954. New system of sea ice classification and symbololy [10] was accepted in 1971, and is currently used in Russia. It unified classification and symbology for such characteristics as ice age (stages of ice development), size of ice floes, ice ridging, ice rafting, melting stage, characteristics of snow cover, presence and orientation of cracks and leads in ice, sea ice compacting and diverging, various hazardous objects, etc. It should be noted, that Russian national symbology for sea ice charts differs significantly from the World Meteorological Organization nomenclature [11]; although, the classifications are almost identical. Actually, Russian ice charts differ from international charts in visual representation, but not in content.
Along with improvement of airborne instruments, the USSR and other countries started developing first artificial satellites for meteorological research. First attempts to apply satellite data for production of sea ice charts were made by the AARI specialists in 1966 with the use of American ESSA-2 and Soviet Kosmos-122 satellite imagery. However, these attempts were more of a scientific interest aimed at using of new data source, since obtaining real-time data for operational use was not possible at that time. The images were recorded on photofilm and then distributed by post from Moscow to AARI, Saint Petersburg (Leningrad at those years). Data delivery could take up to several days. Operational use of satellite imagery began in 1968 when AARI specialists constructed their first receiving station in order to obtain real-time data from ESSA-2 and ESSA-6. In 1975 AARI started reception of real-time data from Soviet satellite Meteor-2. After recording, photofilm was projected onto a paper blank. These blanks contained graticules and coastlines, and photo projection was needed in order to perform georeference of satellite images [12]. After this, ice analysts delineated boundaries of homogeneous ice zones on paper blanks by hand.
For about ten years, satellite observations had been serving as additional data to more widely used airborne measurements. Aerial reconnaissance had remained as the main source of data for ice charting up to 1979 [7].
The mainstreaming of satellite observations began in the 1980s. In 1983, AARI started a program aiming to explore capability of airborne and spaceborne measurements used for operational monitoring of sea ice. Annual field observations were organized on ice near Zhokhov Island in the East Siberian Sea and promoted validation of satellite imagery against aerial and field observations in order to identify the attributes of different ice types. Following the results of these expeditions, ice experts developed manuals for interpretation of sea ice imagery. During the same period AARI also mounted receiving equipment at “North Pole” (“Severniy Polyus”) drifting stations in order to obtain real-time imagery over the entire Arctic, since receiving center in Saint Petersburg covered only the regions of the Greenland, Barents and Kara seas. Ice charts for the eastern Arctic were prepared directly at “North Pole” station and then transmitted to AARI for generating of composed ice chart of the entire Arctic Basin.
It is fair to say that 1980s were the best years in history of sea ice observations [7]. On the one hand, there was a regular and reliable system of aerial observations; on the other hand, capability of satellite imagery had been already explored and accepted by scientific community. Example of ice chart related to that period is presented in Figure 3. The chart was prepared by AARI scientific group at Dikson Island, Kara Sea, in the remote center of the Institute. The group was responsible for operational support of ships navigating through ice in western Arctic seas. Annual Report for 1983-1984 winter season [13], prepared by the group, noted that all ice charts were based on complex use of various data sources: visual observations (both aerial and ground-based), airborne and contact measurements of sea ice thickness, both airborne and spaceborne radar images, visible and IR satellite imagery. Data obtained at Dikson Center was also used for development of sea ice imagery interpretation manuals.
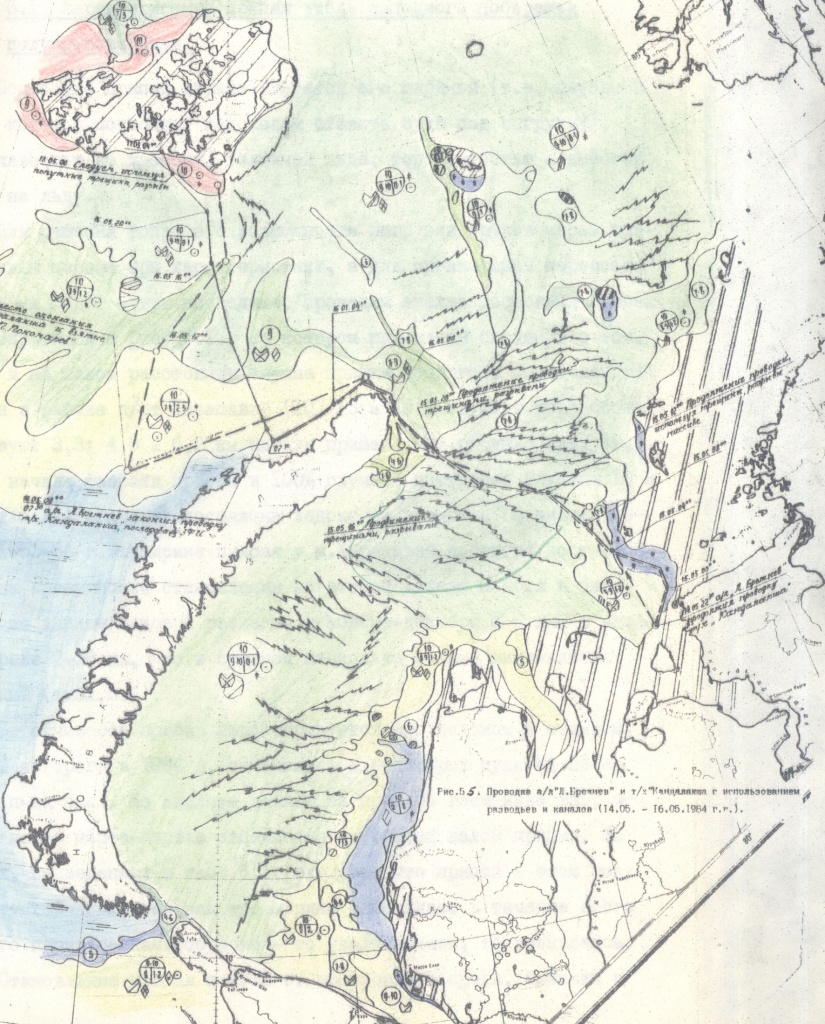
Fig. 3. Sea ice reconnaissance chart for the Kara Sea for May 14-16, 1984. Ice chart is based on visual and instrumental airborne observations accompanied by satellite data [13] (Source: the AARI archives).
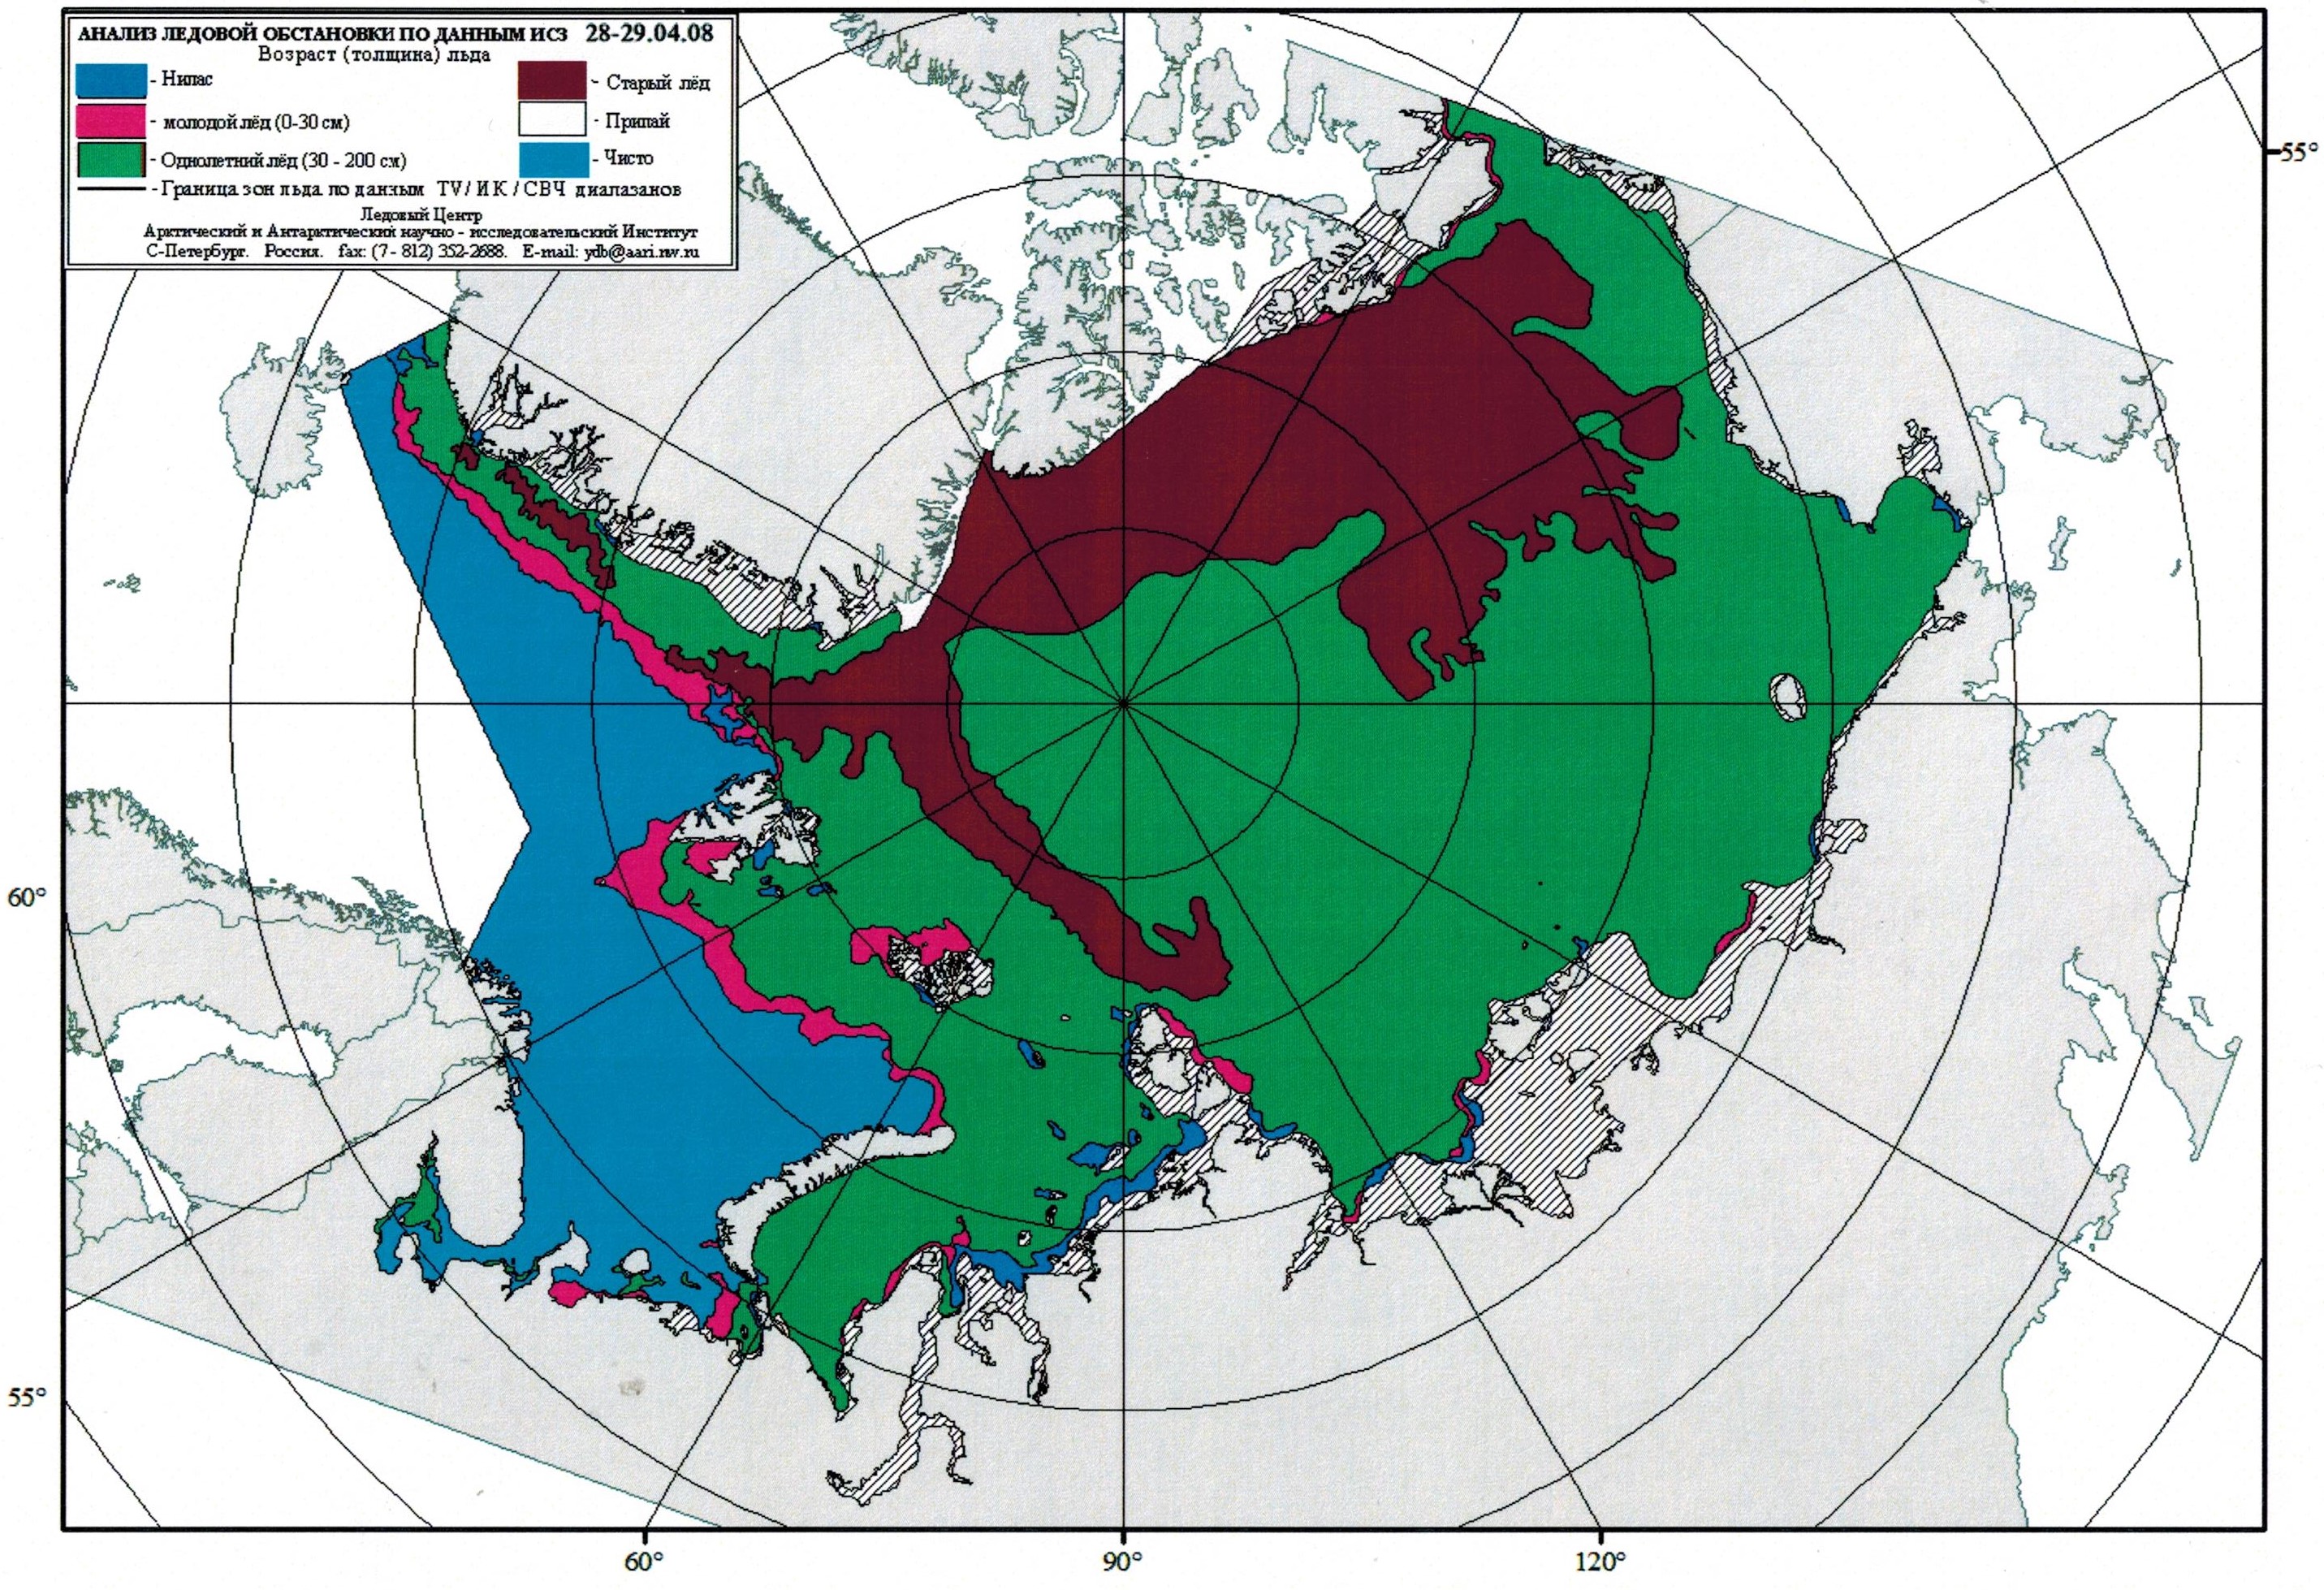
In 1990 AARI stopped aerial ice observations, since then ice charting has been based only on satellite data [7]. Long experience of air reconnaissance formed the basis of the interpretation of multispectral satellite imagery. For example, the interpretation of satellite radar images is based on the interpretation of side-looking airborne radar images [8, 9]; principles of interpretation of images in visible and IR spectral range are based on visual aerial observations [12] and aerial thermal radiometry [9]. An important note must be made here regarding the way of satellite data recording. In mid 1990s information started to display in digital form instead of using photographic films. However, ice charts still had been published in the form of hard copies until the beginning of 2000s (Figure 4) because of absence of essential tools for digital representation of data. In 2006 the Automated Workstation (AWS) “Ice expert” was created in AARI, allowing experts to use GIS applications and to digitize charts.
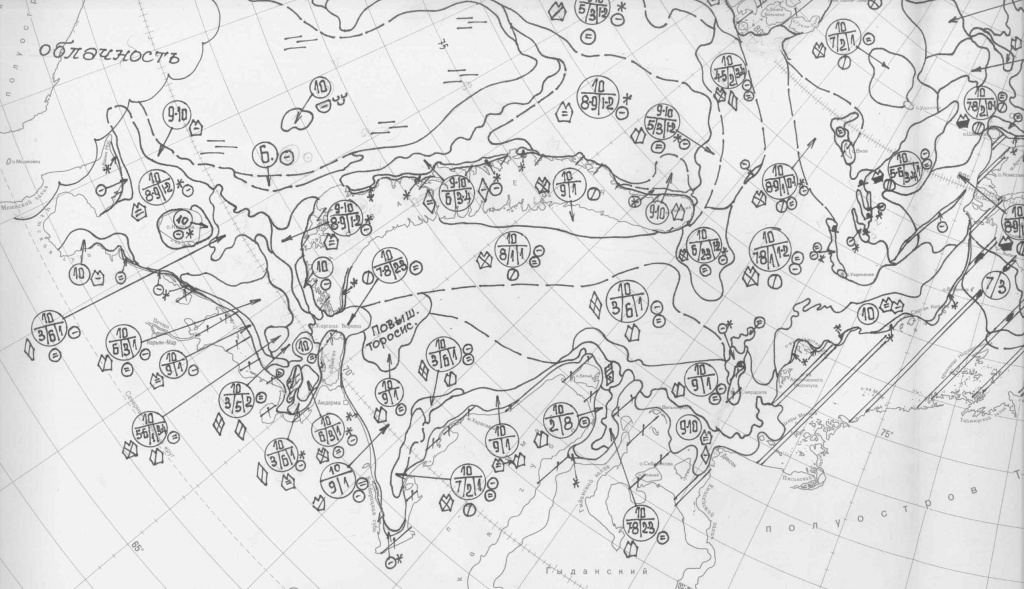
Fig. 4. Part of composite ice chart of the Arctic Ocean (Barents Sea and Kara Sea) for February 15-19, 1997. The chart is based on satellite data only. (Source: the AARI archives).
Ice charting in AARI at the beginning of 21st century.
Implementation of GIS technologies (GIS – geographic information system) allowed all the process of ice charting to be carried out in interactive regime. Since 2000s several generations of ESRI CIS geospatial software were used for this purpose. At present, the complete ice charting production cycle is realized in ArcGIS version 10. Additional toolsets for AWS “Ice expert” allows ice expert to define homogeneous ice zones on georeferenced satellite images, to convert closed boundaries of the defined zones to polygons and to write them in a vector file (in ESRI shape-file format). Attributes corresponding to selected objects are set interactively through a special dialog window with the possibility of further editing. The chart composed of ice zones is visualized automatically with Russian or international symbology according to attribute table. To store and export data, AWS “Ice expert” includes special tools to standardize vector charts according to WMO SIGRID-3 nomenclature [14], as well as to convert vector ice maps from ESRI Shape-file to the Electronic Chart Display and Information Systems (ECDIS) format, for example S-57. Early version of the AWS is described in monograph Remote sensing…, 2007 [15].
1. Data sources. Nowadays the main and often the only source of ice data is remote sensing, since satellites provide the complete coverage of the Arctic Basin several times per day. Mapping procedure is carrying out by an ice analyst based on a variety of satellite data sources (visible range data, radar data, passive microwaves, etc.). General principles of remote sensing methods along with their capabilities in sea ice charting are discussed in detail in the monographs Sputnikovye Metody…, 2011 (in Russian) and Sea Ice: Physics and…, 2015 [16, 17].
Remote sensing data for AARI ice charts is provided by 13 meteorological satellites in direct transmission mode [18]. Since 1996, NOAA data is received by ground-based receiving system located on the roof of the AARI building in Saint Petersburg. The same is for Terra satellite data. Since 2013, satellite receiving site in Barentsburg (Spitzbergen) has carried out permanent reception and automatic processing of visual and IR data from NOAA, MetOp, Terra, Aqua, Suomi NPP, Fengyun satellites; processed images are distributed to ice experts for further analysis. In addition, Sentinel-1 radar images and passive microwave AMSR2 data from open Internet resources are used to generate ice charts. Ice monitoring in areas outside the zones of radio-visibility of satellite receiving stations (e.g., the Far Eastern region of Russia) is completely based on data from open resources [19-22].
Regional ice charts available on the AARI website [23] and in the World Data Center for Sea Ice file server [24] are based on satellite imagery collected over a period of 2-3 days. It is because single-day data often does not allow to have complete data coverage of a region due to clouds and/or darkness (for visible and IR images) and long gaps in data acquisition (for radar images). Generalization of satellite data for 2-3 days gives possibility to compose ice chart which, like a mosaic, consists of several parts referred to different moments of time. The more recent information is in priority. In case of absence of up-to-date information, the data for previous day is used, and so on. All images collected for 2-3 days are loaded into GIS as map layers for further analysis. Regional charts usually do not contain much details, this is why they are often called ‘overview ice charts’.
2. Ice charting methodology in AARI. It is important to note that current methodology of ice charting is entirely based on the experience of earlier generations of ice observers. As it was mentioned in previous section, the results of airborne and field observations served as a basis for all recommendations on interpretation of satellite images. Up until now AARI has been using its traditional methodology which is based on complex analysis of all available data, so the following is largely replicates with previously published works, e.g. [25,26]. The task of ice analyst is the correct interpretation of images in different spectral ranges, which requires high skills in interpreting and experience of visual ice observations; experience of field ice observations enables to improve analyst’s interpretation skills by comparing satellite images with real ice conditions.
Winter period (October 1 – May 31 for the Arctic Seas). Ice charting in winter period starts from the identifying of boundaries of the main ice zones, namely old ice, first-year ice, young ice, nilas (including new ice), as well as location of drifting ice edge and land-fast ice boundaries. To delineate these boundaries, radar images are primarily used. Old ice in the central Arctic is identified due to high values of backscatter, thereby old ice zones have higher brightness comparing with darker first-year ice. Zones with presence of old ice (where partial concentration of old ice is not more than 4-5 tenths) are also clearly recognized. Location of drifting ice edge is identified preferably by radar data since cloud cover makes it difficult to monitor ice edge dynamics on optical images. If more recent information in visible range arises, ice edge location is updated. If the region or its part is covered by clouds for more than 3 days and radar data is not available for this period, passive microwave observations are used to identify ice edge. Passive microwave data is particularly useful in autumn during the period of active freezing when rapid ice formation occurs in large open-water areas and even 1-day gap in satellite observations can lead to a great underestimation of ice-covered area. The usage of passive microwave data for other purposes is limited, because it can give essential errors in ice charting [27-32]. Fast ice boundary is well-defined on radar, visual and IR images, especially when vast polynya is formed along the edge of fast ice due to offshore winds. In case of close connection of drifting ice to fast ice edge and absence of polynya, ice expert identifies fast ice on the basis of several consecutive images (predominantly radar images) acquired over same region. If no ice motion is observed, it is most probable that this is fast ice. Grounded hummocks are identified by the same way. Indirect indicators of grounded hummocks are discussed in detail in the paper by Platonova and Bychkova, 2018 [23]. New ice and nilas are evident as dark, almost black zones on radar images.
Further detailed delineation of homogenous ice zones is better to make by use of images in visible and IR range. Representation of sea ice in the images of visible and near-infrared range depends on surface albedo of ice cover, and in thermal infrared images it depends on ice surface temperature. Both parameters, in turn, are affected by ice thickness. Radar images can’t provide unambiguous identification of different types of first-year ice and young ice. It should be noted that polar night in the Arctic limits using of images in visible range during period from the middle of October till the beginning of February.
Homogeneous zones differ from each other by diverse ice concentration or ice age. Ice concentration is estimated visually and expressed in tenths, where 1 tenth is equal to 10% of sea area. Total ice concentration indicates total area covered by sea ice, and ice age structure indicates a proportion of up to 3 different ice types formed inside every ice zone. The sum of partial concentrations of ice types is always equal to total concentration. Special symbol corresponding with each homogeneous zone shows information about sea ice age structure and size of ice floes. Color code on ‘winter’ charts indicates predominant ice type within an ice zone. Ice charting color code is standardized by the Nomenclature [10]. It should be noted that ice zone with predomination of any given type of ice can contain also some amount of thicker and/or thinner ice.
Summer period (June 1 – September 30 for the Arctic Seas). During summer period, only zones with different ice concentrations are indicated, without specifying of ice age. The reason is that melt water layer upon the ice surface changes significantly visual features of sea ice on all kinds of satellite images and reduces the difference between distinct ice types. To determine total ice concentration during summer period, the most informative sources are radar and visible images. IR data becomes uninformative during this period. Ice concentration is estimated visually in tenths, the same way as in winter. Ice color code for ‘summer’ ice charts is also standardized by the Sea-Ice Nomenclature. Figure 5 represents the example of current ice charts produced by AARI for the East Siberian Sea in different seasons.
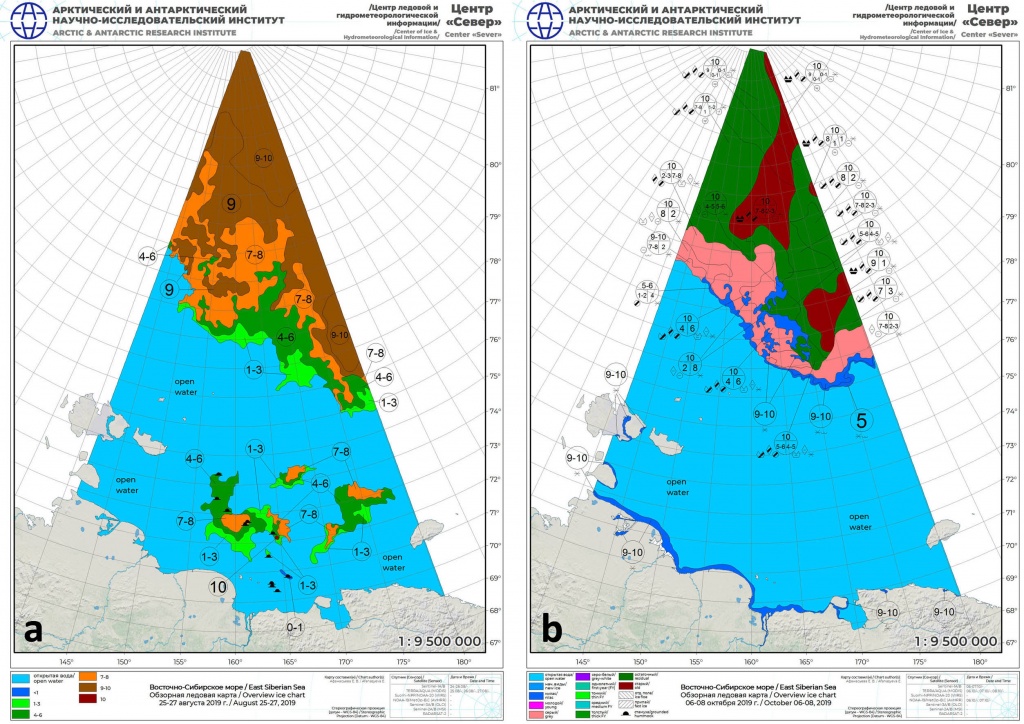
Fig. 5. Examples of regional ice charts produced by AARI for the East Siberian Sea for August 25-27, 2019 (a) and October 6-8, 2019 (b).
3. Auxiliary data sources. Ice expert analyzes satellite information together with other additional data sources. Before identifying ice zones, it is required to estimate magnitude and direction of ice drift for the previous period (in our case – for one week) in order to monitor the movement of ice zones that were detected earlier. It is important for current ice chart to be agreed with previous chart because there is usually no significant change in ice conditions for a time period of a week, except for highly dynamic regions. Operational monitoring of ice drift in AARI is carried out the same way as it was described in paper by Girard-Ardhuin and Ezraty, 2012 [34]. Magnitude and direction of ice drift are calculated automatically by correlation analysis of series of satellite images wich are synthesized from microwave data. Time lag between two images amounts to a week. The main advantage of microwave data is independence from weather and solar illumination, which is particularly significant in high latitudes. While generating daily mosaics of images on the basis of AMSR2 data, fields of ice drift are calculated for the entire Arctic Basin. The obtained fields in a vector format are later used for analysis of motion of ice edge, homogeneous ice zones and separate ice floes. Besides, this information is used for analysis of monthly/seasonal regularities of sea ice motion.
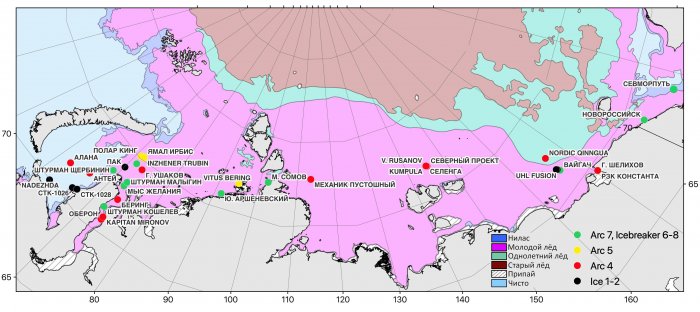
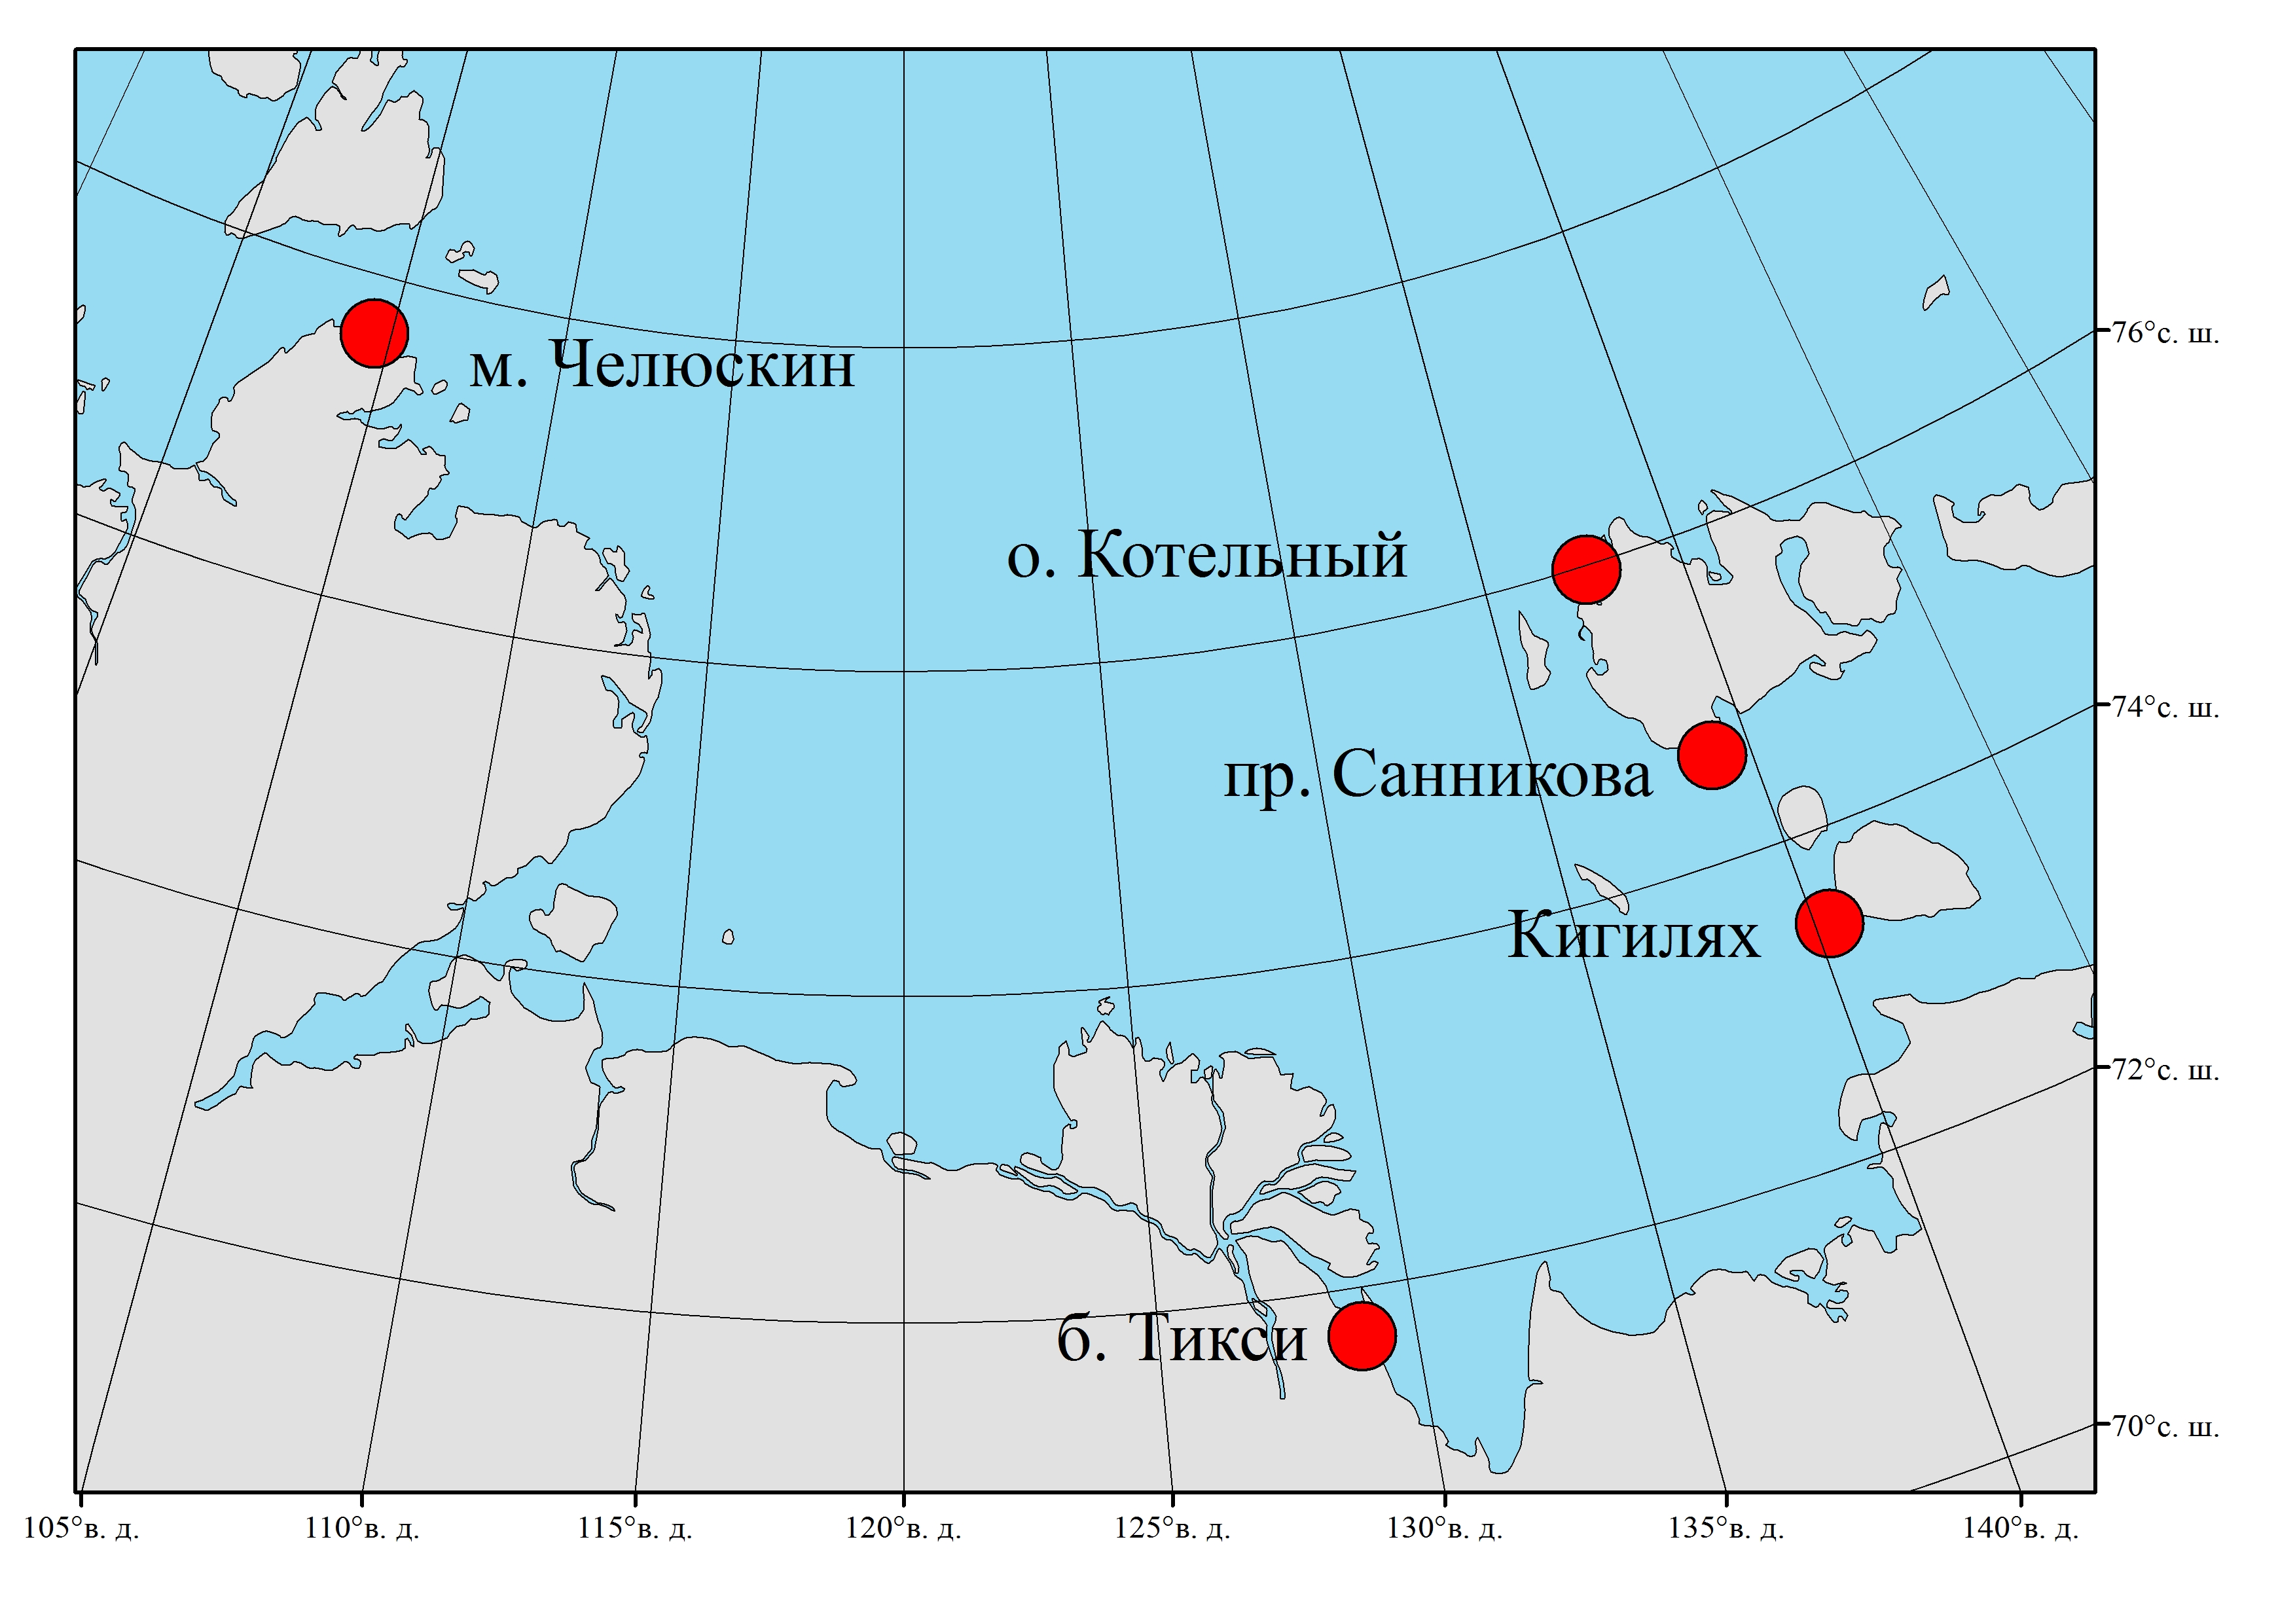
Observations from hydrometeorological stations of Roshydromet are another important data source. This data is transmitted to World Data Center by Territorial Administrations for Hydrometeorological and Environmental Monitoring. Meteorological and ice observations include air and water temperature, outshore visibility distance, drifting ice concentration, extent and thickness of land-fast ice, snow depth. Fast ice thickness measured at a hydrometeorological station serves as a reference. Looking at a satellite image, ice expert matches brightness of drifting ice outside the shore to brightness of land-fast ice with known thickness. Monitoring of ice thickness at seashore stations allows to estimate the rate of ice growth in remote areas. Figure 6 represents distribution of seashore stations that currently provide hydrometeorological data for ice analysis (valid for 2019).
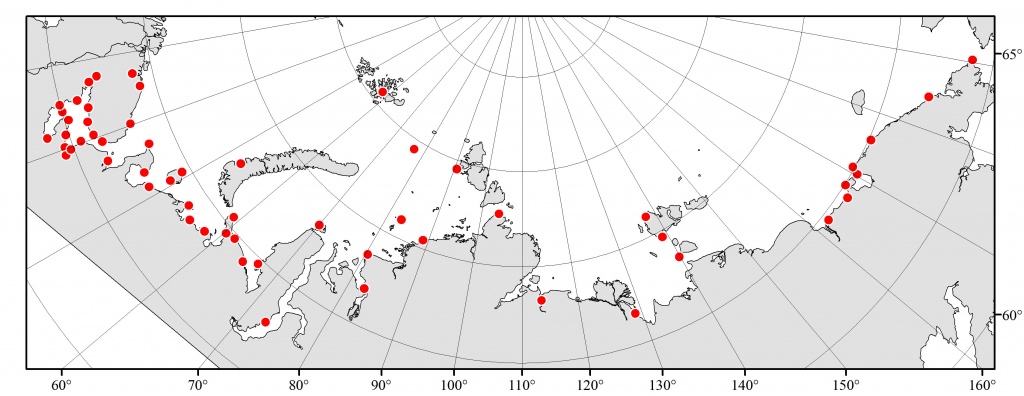
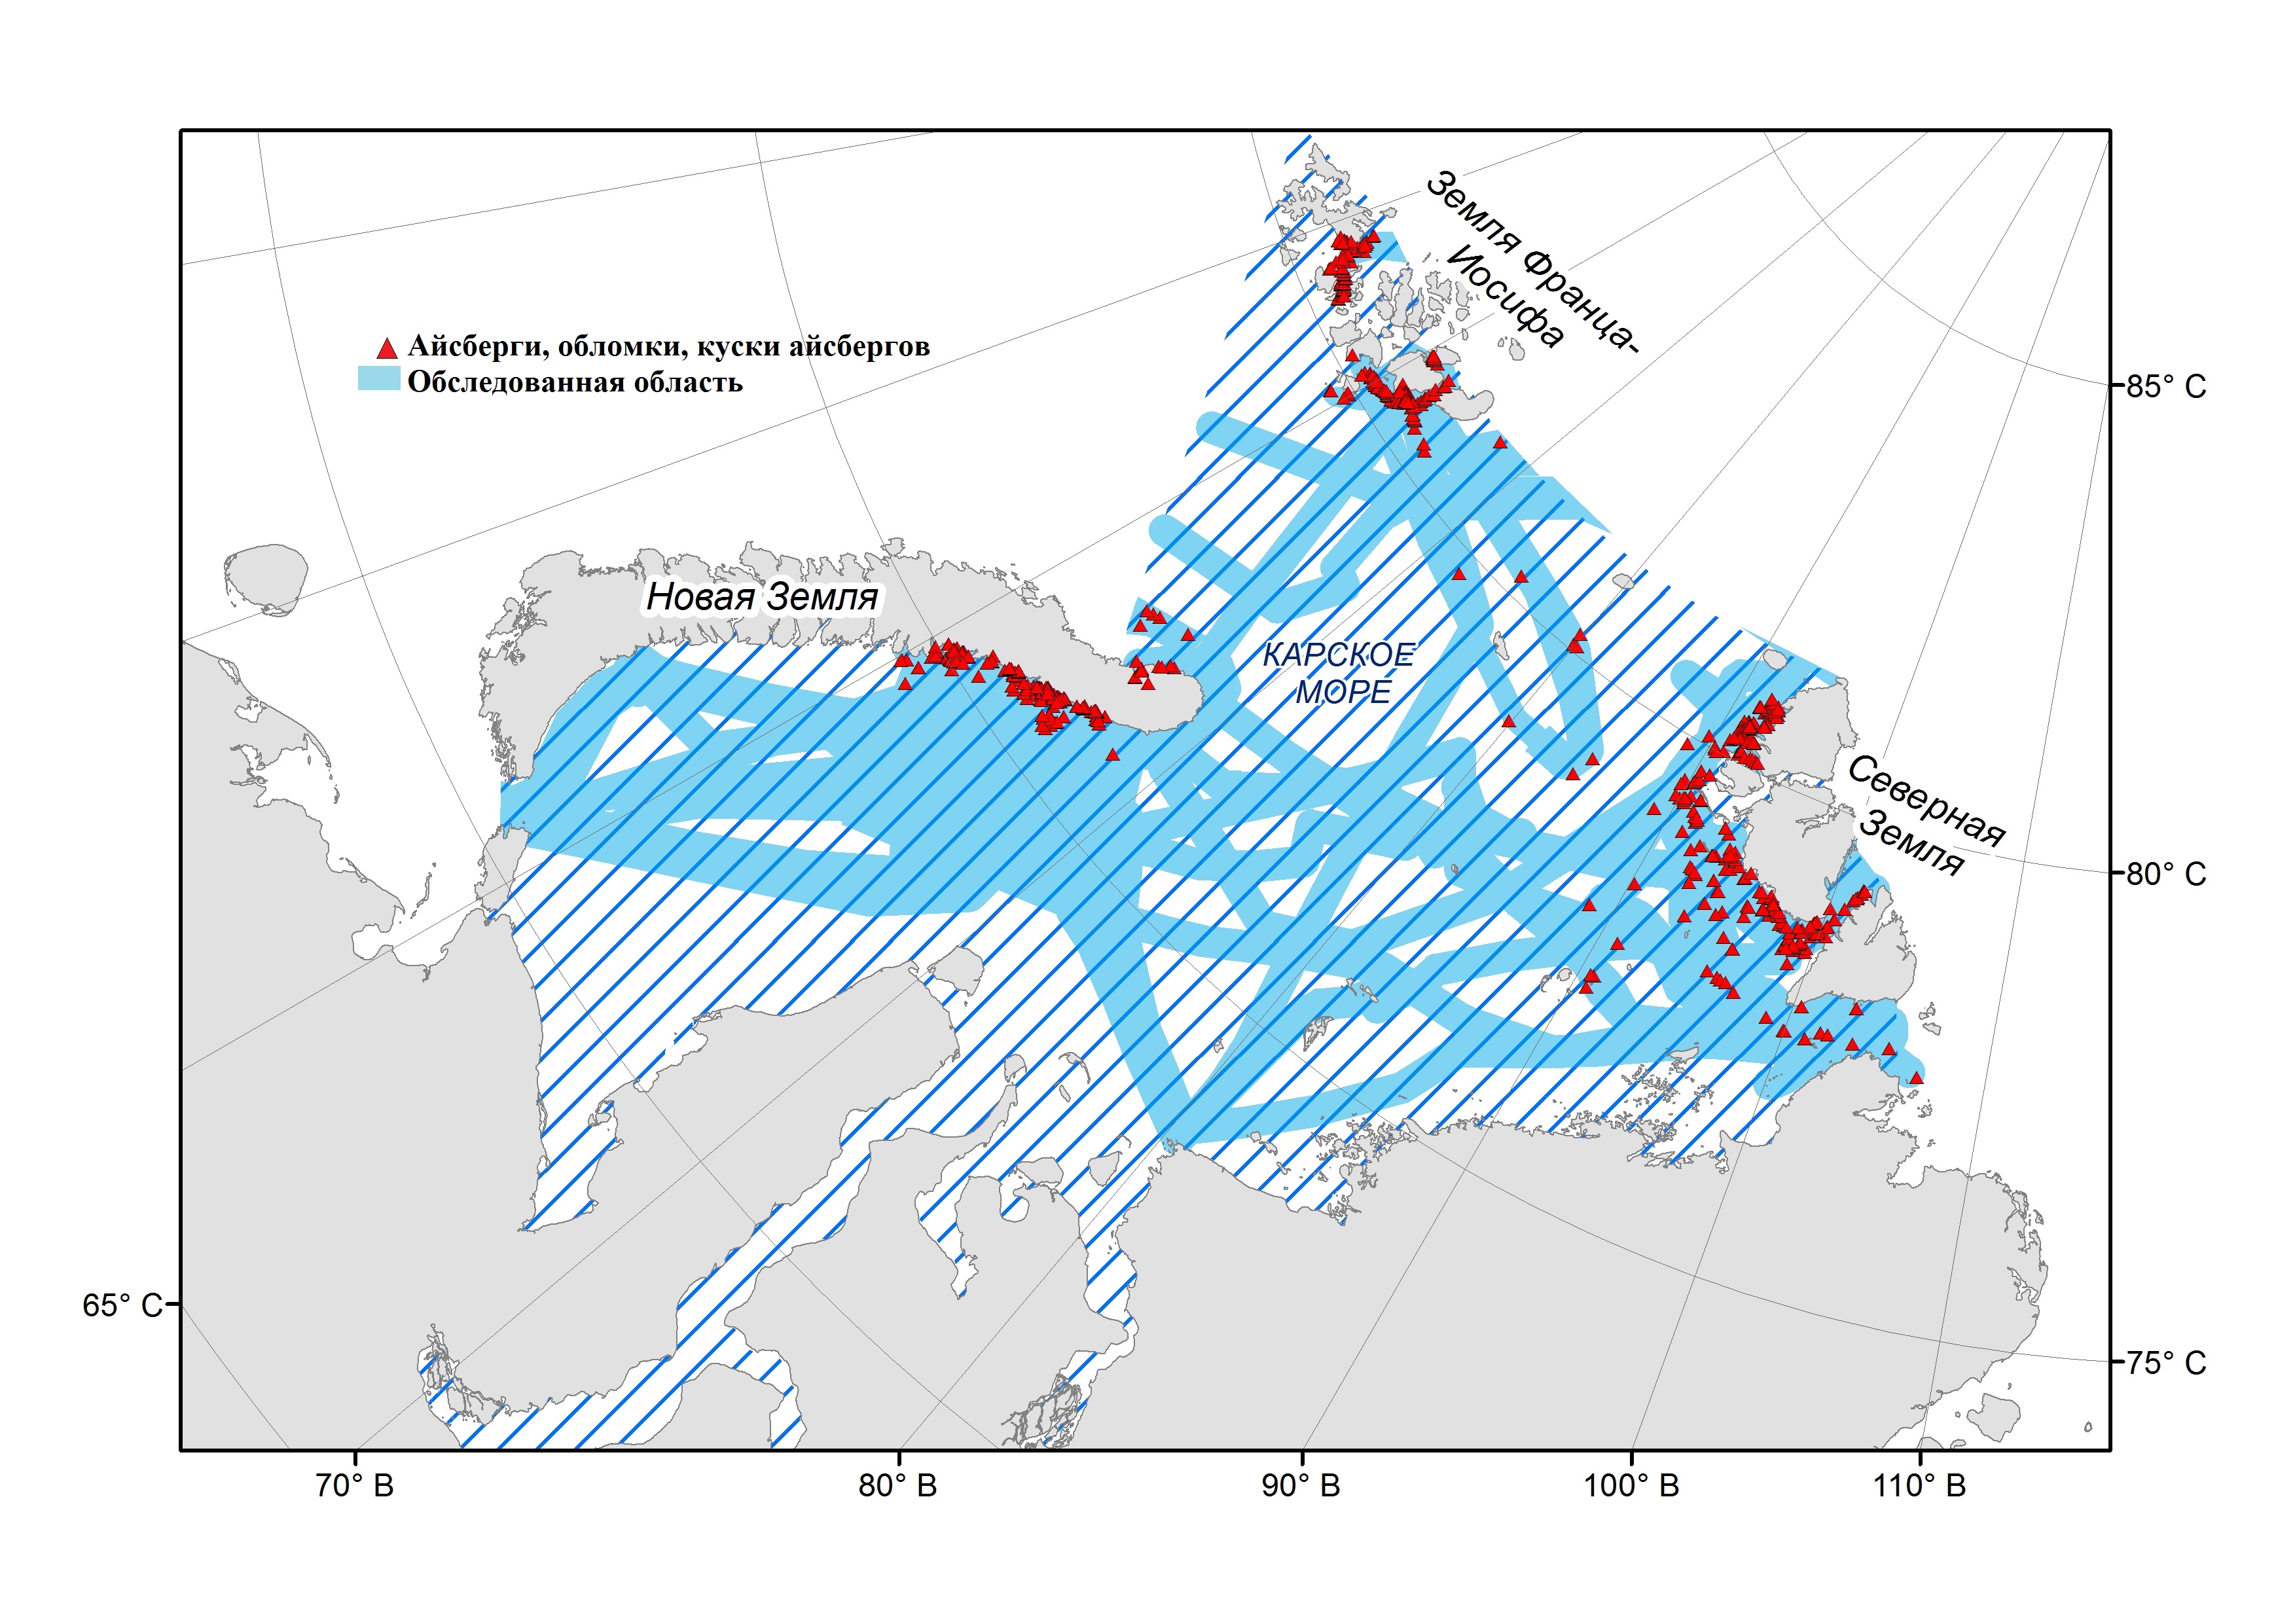
Fig. 6. Seashore stations of Roshydromet in the Arctic in 2019.
Due to inability of regular hydrometeorological measurements in distant offshore areas, model data of Global Forecast System (GFS) [35] is used for estimation of sea ice growth rate in these regions as well as NCEP/NCAR reanalysis open datasets [36]. Ice expert assesses background temperature in analyzed region and approximates the rate of ice growth.
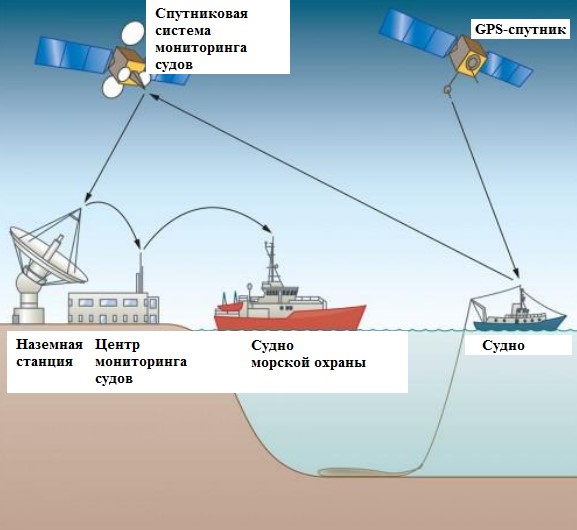
Some of ice class ships navigating the Russian territorial waters send daily routine reports to the Center “Sever” (AARI, St.Petersburg). These reports contain not only standard navigational data, such as vessel name, coordinates, date, etc., but also information on ice and meteorological conditions observed to the moment. At the same time, scientific expeditions with participation of AARI members give detailed recent data on ice and hydrometeorological conditions of the navigation. This is a valuable data source of current state of ice cover which provides validation of ice charts by ice expert.
4. Principles of regional ice charting and managing the work of ice experts. AARI produces weekly regional ice charts for the following arctic seas: Greenland Sea, Barents Sea (together with the White Sea), Kara Sea, Laptev Sea, East-Siberian Sea, Chukchi Sea, and Beaufort Sea (together with the Lincoln Sea). Besides, weekly ice charts for Bering Sea, Sea of Okhotsk (together with the Tatar Strait of the Sea of Japan), Baltic Sea, Caspian Sea and Sea of Azov are created. Areas of the arctic seas are extended to the North Pole to divide the territory of the Arctic Ocean into sectors. Thus, any regional chart covers not only area within geographical boundaries of a particular sea, but also corresponding part of the Central Arctic. Each of the seas is analyzed by one or two experts, who have background knowledge on hydrological and meteorological regime of the region and, preferably but not always, have experience of field observations in this specific region. During winter season ice expert is not changed since it allows the expert to monitor the development of sea ice conditions from the very beginning of ice formation. Therefore, each of the following charts relies on previous ice data. An expert can be changed in summer, if necessary, but it is advisable for ice expert to monitor the same sea area for several years in order to detect main regularities of seasonal variability of ice conditions in a given region.
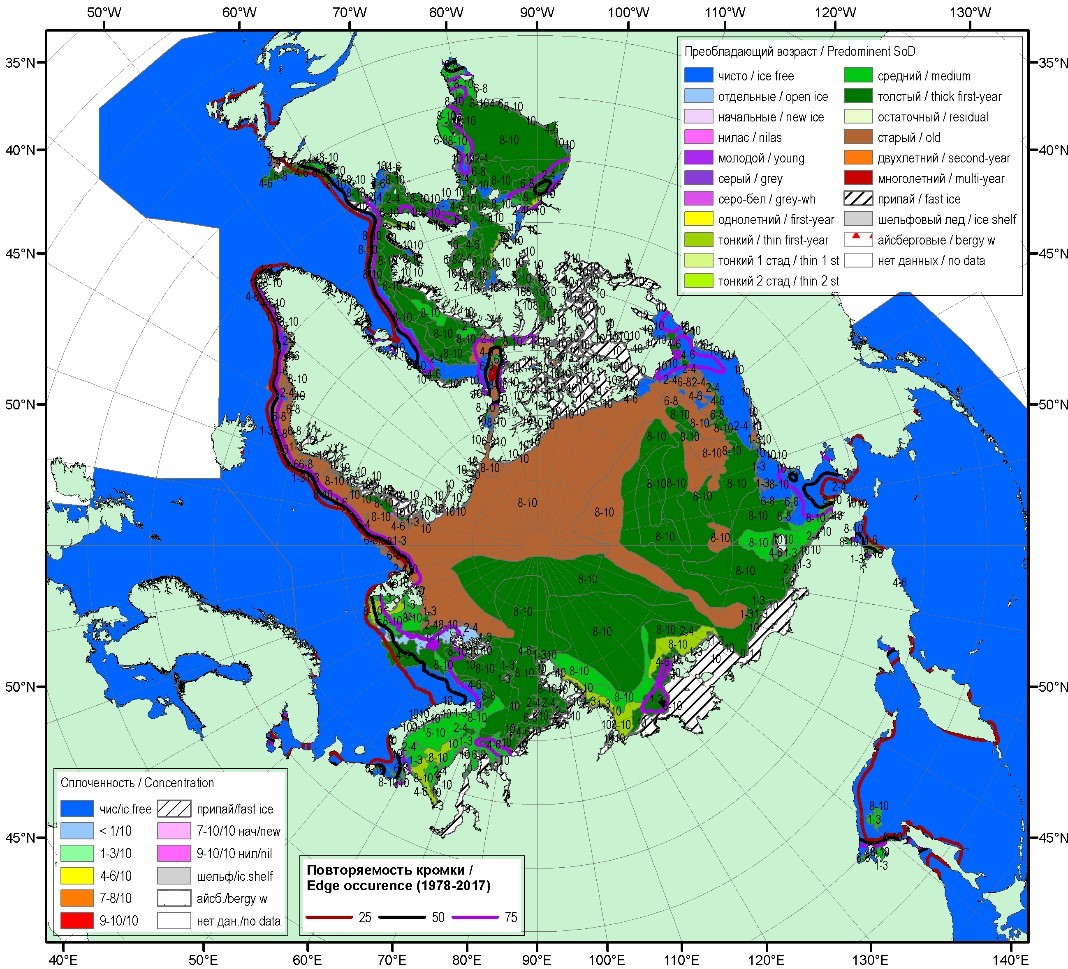
To produce generalized ice chart of the Arctic Ocean, all sectors are merged together. For this purpose, experts are to agree on boundaries of ice zones at the junction lines of adjacent sectors. Regional ice charts are revised by the most experienced head ice expert of the Center “Sever” (AARI) before the release. After merging of regional charts, a generalization is made to identify 6 basic zones in winter period, namely ice free, nilas together with new ice, young ice, first-year ice, old ice and land-fast ice, or 4 basic zones in summer period, namely ice free, open ice (ice concentration is 1-6 tenths), close ice (ice concentration 7-10 tenths) and land-fast ice. Figure 7 shows an example of generalized ice chart. Generalized charts of the Arctic Ocean are weekly updated on the official website of AARI. Ice charts produced since 1997 are archived and also available on this website.
Regional ice charts produced since 1997 are available on the World Data Center for Sea Ice file server [24]. Digitizing of ice charts produced before 1997 is in progress.
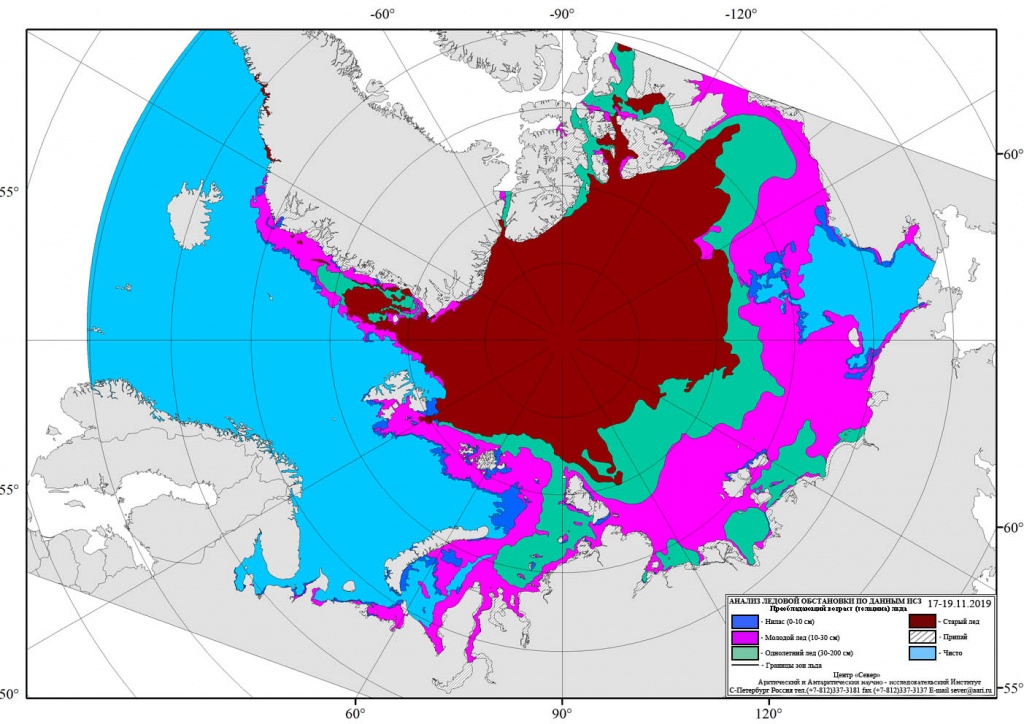
Fig. 7. Generalized ice chart of the Arctic Ocean for November 17-19, 2019. [37]
Conclusion.
Ice charts produced by AARI are widely used for a variety of scientific and practical tasks; however, our experience with users shows that this information requires some clarification. Sea ice cover is a very dynamic environment with magnitude of daily ice drift up to 20 nautical miles and more. At the same time, overview ice charts represent information on ice conditions which are averaged over 2 or 3 days, and different parts of a chart are usually referred to different moments of time. This should be taken into account when comparing AARI ice charts with charts obtained by means of some another methods or algorithms based on single image analysis. For the same reason, it is important for navigators to refer to a time period covered by ice chart. During navigation in ice, it is recommended to make first assessment of ice conditions using overview ice charts with further detailing based on most recent satellite images, meteorological and ice forecasts, and detailed ice charts made for a specific navigation area. Detailed ice charts contain more details and are generated by AARI ice analysts based on single satellite image or several images acquired within 3-hour interval. Overview ice charts are recommended for preliminary planning of maritime operations and general assessment of ice conditions in the area of navigation. It is important to note that color code on ‘winter’ charts indicates only predominant ice type within a given ice zone. Significant information on amount of fractures and leads covered with nilas or young ice is contained in corresponding symbol.
At the end it should be pointed that since late 1980s-early 1990s until now scientists have been dealing with a problem of automatic determination of ice characteristics from satellite data of different spectral bands. A huge amount of works on this topic have been carried out and published for several decades, in particular on automatic determination of sea-ice age (thickness) and sea-ice concentration. A review of the development in this area can be found in the monograph Sea Ice: Physics and…, 2015 [17]. All researchers share the opinion that full automatic interpretation of sea ice is impossible. Every method has always a number of limitations for its application. However, nowadays ice services all over the world integrate automatic methods actively for preliminary analysis of satellite data that is growing constantly. Besides, each algorithm is created for specific conditions, mostly related a season or geographical position of a region; appropriate use of algorithms provides additional valuable information for ice charting. Satellite data in AARI is currently analyzed interactively with implementation of GIS-technologies. However, it is planned to apply automatic techniques as a good tool to force the processing of big data volume and to reduce the degree of subjectivity of analysis. The above mentioned AWS “Ice expert” will allow new techniques to be implemented directly to the process of ice charting.
Acknowledgements.
In this paper, we use unpublished personal memories of staff members of the Center “Sever” (AARI): Bushuev A.V., Bychenkov Yu. D. and Devyataev O.S. We are grateful for all the staff of the Center who contributed to the development of the “Sever” system, for their suggestions and support, and for sharing unique knowledge and skills with young generation of scientists.
References:
2. http://ocean.dmi.dk/arctic/icecharts.uk.php ‒ Danish Meteorological Institute (DMI) ice charts archive. ‒ (accessed 17.11.2019).
3. https://cryo.met.no/ ‒ Norwegian Meteorological Institute (MET.NO) ice charts archive. ‒ (accessed 17.11.2019).
4. https://iceweb1.cis.ec.gc.ca/Archive/page1.xhtml ‒ Canadian Ice Service (CIS) ice charts archive. ‒ (accessed 17.11.2019).
5. https://www.natice.noaa.gov/products/weekly_products.html ‒ The United States National Ice Center (NIC) ice charts archive. ‒ (accessed 17.11.2019).
6. Morya sovetskoj Arktiki. / Vize YU. V. ‒ M. L.: Izd-vo Glavsevmorputi, 1948. ‒ 418 p. (in Russian)
7. Nauchnye issledovaniya v Arktike. / Frolov I. E., Gudkovich Z. M., Karklin V. P., Kovalyov E. G., Smolyanickij V. M.; Edited by Frolov I. E., Karklin V. P. ‒ SPb: Nauka, 2007. ‒ Vol. 2: Klimaticheskie izmeneniya ledyanogo pokrova morej Evrazijskogo shel'fa‒ 135 p. (in Russian)
8. Issledovanie ledyanogo pokrova s pomoshch'yu radiolokacionnyh stancij bokovogo obzora (RLS BO). / Bushuev A. V., Bychenkov YU. D., Loshchilov V. S., Masanov A. D. ‒ L.: Gidrometeoizdat, 1983. ‒ 120 p. (in Russian)
9. Bushuev A. V., Gavrilo V. P., Lebedev G. A. Informativnost' razlichnyh vidov i metodov distancionnyh ledovyh nablyudenij // Morskoj lyod / Edited by Frolov I. E., Gavrilo V. P. ‒ SPb: Gidrometeoizdat, 1997. ‒ P. 345-369. (in Russian)
10. Nomenklatura morskih l'dov, uslovnye oboznacheniya dlya ledovyh kart. ‒ L.: Gidrometeoizdat, 1974. (in Russian)
11. WMO №259, WMO Sea-Ice Nomenclature, ‒ 2017.
12. Issledovanie raspredeleniya i dinamiki morskih l'dov po televizionnym snimkam ISZ "Meteor"./ Bushuev A. V., Bychenkov YU. D. ‒ L.: Gidrometeoizdat, 1978. ‒ 132 p. (in Russian)
13. Report on scientific and operational support for winter navigation in the western Arctic in 1983- 1984. ‒ Diksonskoe UGKS, Dikson Island, 1984. (in Russian)
14. JCOMM Technical Report №23, SIGRID-3: A vector archive format for sea ice georeferenced information and data, ‒ 2014.
15. Bushuev A. V., Loshchilov V. S. Ice chart composition at AARI // in Remote Sensing of Sea Ice in the Northern Sea Route: Studies and Applications. ‒ Chichester: Springer Praxis, 2007. ‒ p. 243-252.
16. Sputnikovye metody opredeleniya harakteristik ledyanogo pokrova morej. Edited by Smirnov V. G. ‒ SPb: AANII, 2011. ‒ 240 p. (in Russian)
17. Sea Ice: Physics and Remote Sensing / Shokr M., Sinha N. K. ‒ New Jersey: Wiley, 2015. ‒ 624 p.
18. Sokolova YU. V. Centr priyoma sputnikovoj informacii AANII na SHpicbergene // Rossijskie polyarnye issledovaniya. ‒ 2019. ‒ Vol. 1, № 35. ‒ P. 19-20. (in Russian)
19. https://worldview.earthdata.nasa.gov/ ‒ NASA Worldview application, part of the NASA Earth Observing System Data and Information System (EOSDIS). ‒ (accessed 02.12.2019).
20. https://www.bou.class.noaa.gov/saa/products/welcome ‒ NOAA Comprehensive Large Array- Data Stewardship System (CLASS). ‒ (accessed 02.12.2019).
21. https://www.polarview.aq/index.php/arctic ‒ Polar View sea ice products database. ‒ (accessed 02.12.2019).
22. http://www.seaice.dk/test.N/2019/ ‒ Technical University of Denmark (DTU) sea ice products database. ‒ (дата обращения: 02.12.2019).
23. http://www.aari.ru/main.php?lg=0&id=17 ‒ AARI regional ice charts archive available through the AARI official web-site. ‒ (accessed 17.11.2019).
24. http://wdc.aari.ru/datasets/d0004 ‒ AARI regional ice charts archive // The World Data Center for Sea Ice. ‒ (accessed 06.12.2019).
25. Bushuev A. V., Paramonov A. I. Obshchie principy i metody deshifrirovaniya i interpretacii dannyh // Morskoj lyod / Edited by Frolov I. E., Gavrilo V. P. ‒ SPb: Gidrometeoizdat, 1997. ‒ P. 338-345. (in Russian)
26. Bushuev A. V. Kompleksnoe ispol'zovanie informacii // Morskoj lyod / Edited by Frolov I. E., Gavrilo V. P. ‒ SPb: Gidrometeoizdat, 1997. ‒ P. 369-376. (in Russian)
27. Knuth M. A., Ackley S. F. Summer and early-fall Sea-ice concentration in the Ross Sea: comparison of in Situ ASPeCt observations and satellite passive microwave estimates // Annals of Glaciology. ‒ 2006. ‒ Vol. 44. ‒ p. 303-309.
28. Alekseeva T., Tikhonov V., Frolov S., Repina I., Raev M., Sokolova J., Sharkov E., Afanasieva E., Serovetnikov S. Comparison of Arctic Sea Ice Concentrations from the NASA Team, ASI, and VASIA2 Algorithms with Summer and Winter Ship Data // Remote Sensing. ‒ 2019. ‒ Vol. 11, № 21.
29. Spreen G., Kaleschke L., Heygster G. Sea ice remote sensing using AMSR-E 89-GHz channels // Journal of Geophysical Research: Oceans. ‒ 2008. ‒ Vol. 113, № C2.
30. Steffen K., Maslanik J. A. Comparison of Nimbus 7 scanning multichannel microwave radiometer radiance and derived sea ice concentrations with Landsat imagery for the north water area of Baffin Bay // Journal of Geophysical Research: Oceans. ‒ 1988. ‒ Vol. 93, № C9. ‒ p. 10769-10781.
31. Steffen K., Schweiger A. NASA team algorithm for sea ice concentration retrieval from Defense Meteorological Satellite Program special sensor microwave imager: Comparison with Landsat satellite imagery // Journal of Geophysical Research: Oceans. ‒ 1991. ‒ Vol. 96, № C12. ‒ p. 21971-21987.
32. Kern S., Lavergne T., Notz D., Pedersen L. T., Tonboe R. T., Saldo R., Soerensen A. M. Satellite Passive Microwave Sea-Ice Concentration Data Set Intercomparison: Closed Ice and Ship- Based Observations // The Cryosphere Discuss. ‒ 2019. ‒ Vol. 2019. ‒ p. 1-55.
33. Platonova E. V., Bychkova I. A. Mnogoletnie nablyudeniya za stamuhami Vostochno- Sibirskogo morya s ispol'zovaniem sputnikovyh dannyh // Uchyonye zapiski RGGMU. ‒ 2018. ‒ Vol. 53. ‒ P. 103-112.
34. Girard-Ardhuin F., Ezraty R. Enhanced Arctic Sea Ice Drift Estimation Merging Radiometer and Scatterometer Data // IEEE Transactions on Geoscience and Remote Sensing. ‒ 2012. ‒ Vol. 50, № 7. ‒ p. 2639-2648.
35. https://www.ncdc.noaa.gov/data-access/model-data/model-datasets/global-forcast-system-gfs ‒ NOAA NCEI web-page with the Global Forecast System (GFS) model description. ‒ (accessed 20.11.2019).
36. https://www.esrl.noaa.gov/psd/data/gridded/data.nmc.reanalysis.html ‒ Web-page with the NCEP/NCAR reanalysis data description. ‒ (accessed 20.11.2019).
37. http://www.aari.ru/main.php?lg=0&id=94 ‒ AARI Arctic Ocean ice charts archive. ‒ (accessed 17.11.2019).

