
Keywords: simulation, accident probability, nips
Introduction. Modern civilization is hydrocarbon-based: energy sector and chemical industry are powered by oil, oil products and natural gas. Exhaustion of old fields forces the exploitation of new oil and gas fields in the Subarctic region and on the shelves of the Arctic seas. This fact requires the development of systems to transport hydrocarbons, in particular, sea transport systems of the Northern Sea Route (NSR) [1, 2, 3].
In accordance with the project Yamal LNG the third LNG (liquefied natural gas) train is already launched in the largest LNG plant located in Sabetta at the Yamal Peninsula. In the near future it is planned to increase its total capacity and come to level of production of 17.4 million tons of liquefied natural gas per annum [4]. Project is based on the resources of the Yuzhno-Tambeyskoye (South-Tambey) gas field which includes reserves of more than 1 trillion cubic meters of natural gas. Liquefied natural gas is exported by six modern carriers by standard navigation routes [5, 6]. Achieving the plant total capacity will increase traffic requirement. Besides, the Northern Sea Route is used for transporting large amount of oil. In the current time hydrocarbons are exported by tankers from the offshore Varandey oil terminal and ice-resistant oil platform Prirazlomnaya located in the Pechora Sea (south-eastern part of the Barents Sea), Kharasavey sea terminal located at the west of the Yamal Peninsula in the Kara Sea, ports of Sabetta and Novy Port at the east of Yamal Peninsula in the Gulf of Ob. Transportation is carried out by modern tankers and LNG carriers. Ice strengthening of vessel class Arc7 allows them to navigate independently stern first in ice up to 2.1 m thick [7, 8].
The study aims to test the computer model of evaluation of accident probability due to ice pressure on the route “Sabetta ̶ Kara Strait ̶ Murmansk” (Fig.1).
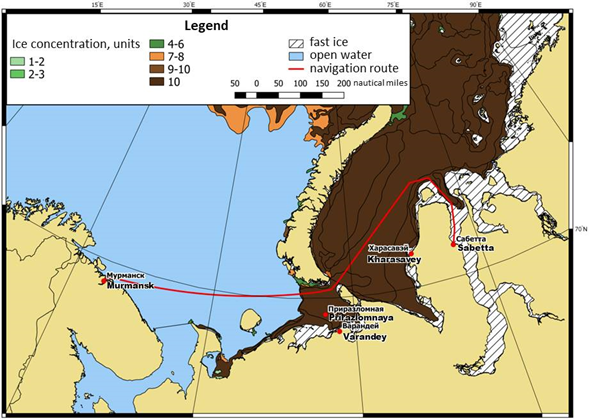
Figure 1. Map of the route. Ice conditions are of the period 10-20 of May, 2018
In the model an accident occurs if vessel is in the zone of ice pressure and ice strength is upper than an amidship. If ridge concentration is more than 2 units than ice strength is taken to be equal to the greater value between level ice strength and strength of consolidated layer of ridges. During the model numerical simulations ice cover characteristics are set as stochastic variables (not deterministic), and their statistical distributions are model parameters. The cumulative distribution functions are following: function of probability for vessel to get into zone under ice pressure; summarized length of a route in very close floating ice; relative lengths of parts of route in very close floating ice of various age; area of homogenous ice zones; lengths of parts of the route under ice pressure and without ice pressure; thicknesses of ice of various age; ridge concentration; ratio of ridge concentration to total ridge and hummock concentration; lengths of linear ridges; widths of ridges; ratio of ridge width to ridge altitude; thickness of consolidated layer of ridges. In Monte Carlo simulation, a random number generator provides a decimal fraction in the [0,1] interval which is considered as value of cumulative distribution function of the given characteristic of ice cover. Based on this value the quantile is estimated which is a specific value of ice characteristic. In the model we take into account only static interaction between hull and ice. Strength of the hull’s elements is estimated according to the requirements of the Russian Registry of Shipping. If randomly generated ice strength and its statistical distribution exceed the strength of a vessel, this cause hull destruction and emergency situation. Statistical distributions of ice characteristics are based on ice maps of the Arctic and Antarctic Research Institute (AARI) archive, data on AARI expeditions and literature sources. Ice compression strength depends on many factors. Study on ice compression strength in ice interactions with different structures are high-demand and carried out by Russian [15-19] and foreign [20-24] specialists.
Ice strength depends on its thickness. During the period from the beginning of sustainable ice formation to the beginning of summer thawing ice thickness is determined by its age. Ridging develop predominantly in young and thin first-year ice (FYI). Newly-formed ridges are made of single ice rubbles that have the same thickness as the parent ice floe. Thus new ridges don’t pose a risk of ship besetting under ice pressure. The situation changes when the consolidation of part of single ice rubbles occurs and forms so called consolidated ice layer. It is supposed that navigators are able to avoid ridges if ridge concentration is up to 2 units according to Russian nomenclature (i.e. 2/5). In this case strength of level ice alone is taken into account; notably, both strength of deformation and strength of fracture are examined [25], and the lowest value is taken as the ice strength.
According to studies [26, 27] ridge concentration is 50% of total hummock and ridge concentration. Spatial orientation of ridges is random [27, 28], thus distribution of ridge orientations is set as proportional and mean angle between the direct course of a vessel and the ridge line is 45%.
Pre-processing of statistical distributions of summarized lengths of parts of the route characterized by specific parameters of ice cover is based on vector maps of ice conditions from AARI archive. These maps were made by the Centre of ice meteorological information of AARI on the base of remote sensing data [29].
Processing of vector map is made with use of ArcGIS as follows: polygonal objects of ice maps are crossed by linear object of navigation route. As a result a layer of linear objects is created that have the same sets of attributes as those of the crossed polygons. After that selection of objects according to their attribute values is done and lengths of the objects are calculated. Objects with total ice concentration not less than 9 units (9/10) with presence of ice older than young stage are identified, subsequently the selected objects are added to the new layer of parts of the route. Next step is to sort objects by age and to add them into separate layers. Lengths of individual objects and summarized lengths of objects that meet certain criteria are calculated. These result in ten-days series of lengths of the route segments in close ice, in close ice with presence of young (up to 10 cm thick), grey (10-15 cm thick), grey/white (15-30 cm thick), thin FYI (30-70 cm thick), medium FYI (70-120 cm thick), thick FYI (more than 120 cm thick). Besides, ten-days series of summarized lengths of parts of route in close ice with partial concentration of thick first-year ice of at least 5 tenths and summarized lengths of parts of route in close ice with sum of partial concentrations of thick first-year ice and medium first-year ice of at least 5 tenths are calculated.
The origin set of numeric variables for statistical distribution of parameter values of the model should be homogeneous. Thus the analysis of obtained numerical series for presence of interannual trend is made based on cumulative curves. Method of cumulative sums originally was applied in hydrology to examine the presence or absence of directed trends in the interannual dynamic of annual river discharges [30]. Afterwards it was applied for preliminary interannual variability analysis of any environmental parameters. Summary of this method is the following. A plot is made with years on the x-axis and cumulative sums of parameter values of specific years on the y-axis. In our case these are the values of the same within-year (intra-annual) ten-day interval of different years. Cumulative sum for particular year is the sum of values from the beginning of the time series to this particular year inclusive. For the first year it is the value itself, for the second year it is the sum of the values of both the first and the second year, etc. Data points of cumulative sums on the plot are connected with a line. The line must be close to the straight line in case of the absence of interannual variability. The kinked or broken-line curve show that there is a trend and the data is heterogeneous.
For curves that are close to straight line the original numerical series is divided into halves to examine its homogeneity. For kinked or broken-line curve the original numerical series is divided into parts in the points of inflection. If number of elements is not enough for statistical analysis, than original numerical series is divided into two parts in the point of the most significant inflection. Next step is testing the null hypothesis that two parts belong to one population, that means the absence of significant differences between these two samples. Verification is made in Mathcad with use of Mann-Whitney-Wilcoxon and Siegel-Tukey nonparametric tests.
Statistical distributions of model parameters were made in Mathcad based on methods of Hazen, Kritskiy-Menkel, Tchegodayev and Gringorten. Statistical distributions that were obtained by different methods varied inessentially. Therefore statistical distributions calculated by Gringorten method which combine three other methods were used in the model (Fig.2).
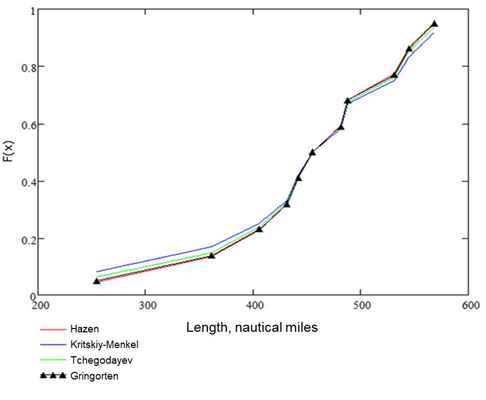
Figure 2. Cumulative distribution function of length of the route in close ice for the first ten-day period of May calculated by different methods.
| A – B | < (A*0.001). Numerical experiment also ends in case of 10001 accident-free navigations.
However, there is a possibility for maximal number of navigations per ten-days period to be substantially less than number of navigations which provides stabilization of the ratio of number of accidents to number of navigations. In this case in one numerical experiment (series of navigations) maximal number of navigations which is expected for a given ten-days interval throughout the entire period of operation of this sea transport system is set. The numerical experiment is forced to end after accomplishing of this number of iterations without regard for stabilization of accidents to navigations ratio. Both in automatic and forced end of numerical experiments user establishes a number of numerical experiments in one computer calculation. The ratio of number of accidents to number of navigations is regarded as probability of accident. Since one computer calculation consists of a series of numerical experiments, the probability of accident should be regarded as a random variable with mathematical expectation (E) and root-mean-square deviation (RMSD). According to central limit theorem, statistical distribution of a random variable will approximate a normal distribution since it is contributed by variety of factors. As an upper bound of accident probability we suggest to use sum of E and triple RMSD with running series of not less than 30 numerical experiments with forced end. In that case probability of greater accident rate according to three-sigma rule is only 0.15%. Thus this approach should be applied to estimate expected damage.
Results and discussion. The model was tested for the most difficult ice conditions of the first 10-days period of May. The ratio of number of accidents to total number of navigations in case of automatic end of numerical simulations for 70000-toner Arc7 vessel was 0.023. The most important stage of simulation modeling in scientific researches is model sensitivity testing to parameters varying. For this purpose we set a number of simulations with fixed maximum and minimum parameters according to their statistical distributions. For example, to learn model sensitivity to variation of total hummock and ridges concentrations we have compared results of simulations of situation of absence of ridges and situation of maximum ridge concentration of 4.5 units (i.e. up to 90% of ice area is covered by ridges). This procedure is necessary to verify the model: if changing the value of specific parameter is evidently supposed to cause accident but has no effect on simulation results, then there is an appreciable error in model algorithm or program code. Besides, this procedure reveals the most sensitive parameters of the model, which require additional field study and/or specific processing of previous data of expeditions, experiments, satellite data, etc. Results of simulations for determining the most important parameters are represented in Table 1. “Reference” scenario means that all values are based on files of statistical distributions and random numbers generation. Otherwise input values for testing model for sensitivity to a specific parameter are set by user. Processing and averaging of results is made using R.
Table 1 – Model outputs for different parameters.
|
Model parameters |
Parameter minimum and maximum |
Probability of accident
(average for 30 simulations) |
|
«Reference» scenario |
- |
0.023 |
|
Length of route in close ice |
min – 255 nm (nautic miles) |
0.016 |
|
max – 567 nm |
0.028 |
|
|
Ridge concentration |
min – 0 units |
0 |
|
max – 4.5 units |
0.030 |
|
|
Probability of ship besetting under ice pressure |
min – 0 |
0 |
|
max – 0.02 |
0.044 |
|
|
Length of parts of route under ice pressure |
min – 2.9 nm |
0.017 |
|
max – 69.7 nm |
0.027 |
|
|
Length of parts of route without ice pressure |
min – 6.2 nm |
0.441 |
|
max – 1609.7 nm |
0.009 |
Thereby, parameters that governed the probability of accident are following: length of the route in close ice, total ridge and hummock concentration, probability of ship besetting under ice pressure and length of parts of route under ice pressure.
The results of 450 numerical simulations with varying vessel ice classes and vessel displacements are presented in Table 2.
Table 2 – Simulation results of navigations of different vessel ice classes and displacements
|
Vessel ice class |
Vessel displacement, thousand tons |
Probability of accident (average on 30 calculations) |
|
Arc5 |
45 |
0.025 |
|
70 |
0.025 |
|
|
85 |
0.024 |
|
|
Arc6 |
45 |
0.025 |
|
70 |
0.024 |
|
|
85 |
0.025 |
|
|
Arc7 |
45 |
0.024 |
|
70 |
0.024 |
|
|
85 |
0.023 |
|
|
Arc8 |
45 |
0.022 |
|
70 |
0.024 |
|
|
85 |
0.023 |
|
|
Arc9 |
45 |
0.022 |
|
70 |
0.022 |
|
|
85 |
0.020 |
The results are visualized on Figure 3. The data indicates that stronger ice class reduces probability of accident. Thus, the model simulates correctly the increasing strength of the hull in case of increasing ice class.
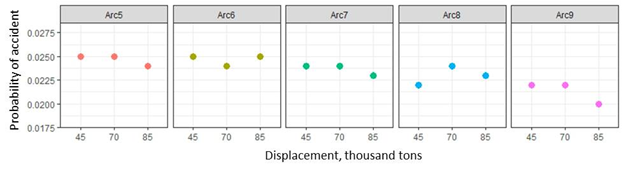
Figure 3. Simulation results for different ice classes of vessels
Table 3 – Simulation results with forced setting of number of navigations
|
Ice class |
Number of navigations in one experiment |
Probability of accident (average for 30 simulations) |
|
Arc5 |
30 |
0.104 |
|
100 |
0.040 |
|
|
500 |
0.026 |
|
|
1000 |
0.023 |
|
|
Arc6 |
30 |
0.091 |
|
100 |
0.046 |
|
|
500 |
0.025 |
|
|
1000 |
0.024 |
|
|
Arc7 |
30 |
0.132 |
|
100 |
0.051 |
|
|
500 |
0.024 |
|
|
1000 |
0.023 |
|
|
Arc8 |
30 |
0.257 |
|
100 |
0.043 |
|
|
500 |
0.023 |
|
|
1000 |
0.023 |
|
|
Arc9 |
30 |
0.097 |
|
100 |
0.039 |
|
|
500 |
0.024 |
|
|
1000 |
0.022 |
Conclusions. In this study the computer model of evaluation of accident probability due to ship besetting under ice pressure on the route “Sabetta ̶ Kara Strait ̶ Murmansk” was tested. To conduct numerical experiments the distributions of parameters of the model (i.e. characteristics of ice cover) are prepared, these are: thickness of consolidated layer of ridges, ratio of ridge width to ridge altitude, percentage of ridge concentration, total ridge and hummock concentration, lengths of parts of route without ice pressure, length of navigation route in close ice, relative length of route in close ice with presence of thick FYI, medium FYI, thin FYI and young ice. For data preparation ten-day interval vector maps of ice conditions on the route for the period 1997-2018 from AARI archive were processed. Obtained series of lengths were tested for having a trend based on method of cumulative curves and were tested for homogeneous by use of Mann-Whitney-Wilcoxon and Siegel-Tukey nonparametric tests. Statistical distributions were based on methods of Hazen, Kritskiy-Menkel, Tchegodayev and Gringorten.
The main conclusions from the results of simulations include the following:
1) Parameters that markedly affect the accident probability are length of the route in close ice, total ridge and hummock concentration, probability of ship besetting under ice pressure, lengths of parts of route under ice pressure;
2) Calculations with forced end of numerical experiments with small number of navigations show accident probability several times higher than those with more than 100 navigations or in case of automatic end;
3) Probability of accident due to ice pressure for ice class Arc7 is 0.023 on navigation route “Sabetta ̶ Kara Strait ̶ Murmansk” during first ten-day period of May which is characterized by the most difficult ice conditions on the route.
Risk assessment is crucial for strategic planning of logistic systems for production and transportation of hydrocarbons in the Arctic.
It is necessary to note that research activities in this field are in progress. For instance, lengths of parts of route in various types of ice have already been calculated for another high-demand navigation route “Sabetta-the Bering Strait”.
1. S.V. Babich, A. A. Yakovleva, Transport and logistics potential of the Northern Sea Route in the Eurasian economic space // Russian Arctic, Moscow, issue 4, p. 5-14, 2019 (In Russian)
2. Minyang Zhang, Di Zhang,
3. Chi Zhang, Di Zhang, Shanshan Fu, Mingyang Zhang, Interpretative Structural Modeling of Ship Energy Efficiency in Arctic Navigation // Proceedings of the 24thInternational Conference on Port and Ocean Engineering under Arctic Conditions June 11-16, 2017, Busan, Korea
4. http://yamallng.ru/press/news/37034/ ‒ Site of “YAMAL LNG” project, reference date ‒ 20.06.2019
5. https://www.ashipping.ru/geo/49/‒ Site of ”ASCO” Company, reference date ‒ 20.06.2019
6. Frédéric Jean Louis Hannon, Shipping LNG from the Arctic: A True Story // Proceedings of the Twenty-ninth (2019) International Ocean and Polar Engineering Conference, Honolulu, Hawaii, USA, June 16-21, 2019, р. 866-874
7. https://www.vestifinance.ru/articles/103595 ‒ Site of “Vesti E`konomika” information agency, reference date ‒ 20.06.2019
8. Hyeok Geun Ki, Joong Hyo Choi, Sung Gun Park, Sung Kon Han, Ice Collision Analysis and Alternative Full Scale Impact Test for ARC 7 LNG Carrier // Proceedings of the 24thInternational Conference on Port and Ocean Engineering under Arctic Conditions June 11-16, 2017, Busan, Korea
9. Liyanarachchi W. A. de Silva, Hajime Yamaguchi, Numerical Study of Oil Spilled Behavior under Ice–Covered Area in the East Siberian Sea // Proceedings of the 24th International Conference on Port and Ocean Engineering under Arctic Conditions June 11-16, 2017, Busan, Korea
10. Hossein Babaei, David Watson and Richard Burcher, Verification and Validation of An in-Ice Oil Spill Trajectory Model Based on Satellite-Derived Ice Drift Data // Proceedings of the 24th International Conference on Port and Ocean Engineering under Arctic Conditions June 11-16, 2017, Busan, Korea
11. Megan O’Sadnick, Chris Petrich, Nga Dang Phuong, The Entrainment and Migration of Crude Oil in Sea Ice, the Use of Vegetable Oil as a Substitute, and Other Lessons from Laboratory Experiments // Proceedings of the 24th International Conference on Port and Ocean Engineering under Arctic Conditions June 11-16, 2017, Busan, Korea
12. Aleksandr Tezikov, Andrei Afonin, Vitaly Kljuev, Research of Quantitative Indicators of Tightness of the Northern Sea Route (NSR) // Proceedings of the 24th International Conference on Port and Ocean Engineering under Arctic Conditions June 11-16, 2017, Busan, Korea
13. V.Yu. Tretyakov, S.V. Frolov, D.V. Terentyeva, Simulation of ecological risks of environment pollution by hudrocarbons during their transportation within the Kara Sea by tankers // Meteorologicheskij vestnik, St. Petersburg, volume 8, issue 1, p. 59-87, 2016 (In Russian)
14. G.W. Timco, W.F. Weeks, A review of the engineering properties of sea ice // Cold Regions Science and Technology, Volume 60, Issue 2, February 2010, Pages 107-129. DOI: 10.1016/j.coldregions.2009.10.003
15. R.V. Goldstein and N.M. Osipenko, Some aspects of the mechanics of sea ice strength // Physical mesomechanics, vol. 17, issue 6, p. 59-69, 2014 (In Russian)
16. O. Timofeev, K. Sazonov, A. Dobrodeev, Ye. Bokatova, I. Sapershtein, Strength studies of sea ice in support of software development for ice load calculation // Trudy` Kry`lovskogo gosudarstvennogo nauchnogo centra, issue 4 (386), p. 41-49, 2018 (In Russian)
17. V.A. Polit’ko, I.G. Kantarzhi, Characteristics of ice, needed for ice loadings determination // Vestnik MGSU. Proceedings of Moscow State University of Civil Engineering, issue 12, p. 106-117, 2015 (In Russian)
18. Roman B. Guzenko, Yevgeny U. Mironov, Ruslan I. May, Viktor S. Porubaev, Victor V. Kharitonov, Stepan V. Khotchenkov, Konstantin А. Kornishin, Yaroslav О. Efimov, Petr А. Tarasov, Morphometry and Internal Structure of Ice Ridges in the Kara and Laptev Seas // Proceedings of the Twenty-ninth (2019) International Ocean and Polar Engineering Conference, Honolulu, Hawaii, USA, June 16-21, 2019, р. 647-654
19. Alexey K. Naumov, Elena A. Skutina, Nikolay V. Golovin, Nikolay V. Kubyshkin, Igor V. Buzin, Yuri P. Gudoshnikov, Andrey A. Skutin, Peculiarities of morphometric features and inner structures of the ridged formations in the Ob’ Bay // Proceedings of the Twenty-ninth (2019) International Ocean and Polar Engineering Conference, Honolulu, Hawaii, USA, June 16-21, 2019, р. 684-890
20. Pernas-Sánchez J, Pedroche D, Varas D, López-Puente J, Zaera R., Numerical modeling of ice behavior under high velocity impacts // International Journal of Solids and Structures (2012) 49(14), p. 1919-1927, DOI: 10.1016/j.ijsolstr.2012.03.038
21. Hopkins M, Tuhkuri J, Compression of floating ice fields // Journal of Geophysical Research: Oceans (1999) 104(C7), p. 15815-15825, DOI: 10.1029/1999jc900127
22. Mikko Suominen, Arttu Polojärvi, Annu Oikkonen, Ridge Profile Measurements for Understanding Ridge Resistance // Proceedings of the 24th International Conference on Port and Ocean Engineering under Arctic Conditions June 11-16, 2017, Busan, Korea
23. Evgenii Salganik, Knut Vilhelm Høyland, Aleksey Shestov, Thermodynamics and Consolidation of Ice Ridges for Laboratory Scale // Proceedings of the 24th International Conference on Port and Ocean Engineering under Arctic Conditions June 11-16, 2017, Busan, Korea
24. Hanyang Gong, Arttu Polojärvi, Jukka Tuhkuri, Preliminary 3D DEM Simulations on Ridge Keel Resistance on Ships // Proceedings of the 24th International Conference on Port and Ocean Engineering under Arctic Conditions June 11-16, 2017, Busan, Korea
25. Meng Zhang, Harsha Cheemakurthy, Karl Garme & Magnus Burman, An Analytical Model for Ice Impact Load Prediction // Proceedings of the Twenty-ninth (2019) International Ocean and Polar Engineering Conference, Honolulu, Hawaii, USA, June 16-21, 2019, р. 807-814
26. Lebedev A.A., Romanov I.P., Uralov N.S., Ocenka prirashheniya tolshhiny` ledyanogo pokrova Arkticheskogo bassejna za schyot torosisty`x obrazovanij // Trudy` AANII, vol. 396 “Issledovanie ledyanogo pokrova polyarny`x oblastej”, Leningrad, GMI, 1985, p. 6-22 (In Russian)
27. Mironov E.U., O sezonnoj izmenchivosti torosistosti // Trudy` AANII, vol. 396 “Issledovanie ledyanogo pokrova polyarny`x oblastej”, Leningrad, GMI, 1985, p. 38-45 (In Russian)
28. Marchenko A.V., Osobennosti formy` i prostranstvennogo raspredeleniya torosov / Ledyany`e obrazovaniya morej Zapadnoj Arktiki. Pod. red. G.K. Zubakina. SPb, AANII, 2006. 272 p. P. 198-201 (In Russian)
29. Brestkin S.V., By`chenkov Yu.D., Devyataev O.S., Folomeev O.V., Securing Hydro-Meteorological Safety of the Arctic Region // Materialy` mezhdunarodnoj nauchno-prakticheskoj konferencii «Problemy` preduprezhdeniya i likvidacii chrezvy`chajny`x situacij v Arkticheskom regione. Bezopasny`j gorod v Arktike», 2016, MChS Rossii. P. 68-72 (In Russian)
30. Gosudarstvennoe uchrezhdenie «Gosudarstvenny`j gidrologicheskij institut» Standart organizacii STO GGI 52.08.41-2017, «Osnovny`e gidrologicheskie xarakteristiki pri nestacionarnosti vremenny`x ryadov, obuslovlennoj vliyaniem klimaticheskix faktorov, Rekomendacii po raschetu» // SPb: 2017 (In Russian)

")
")
")
")
